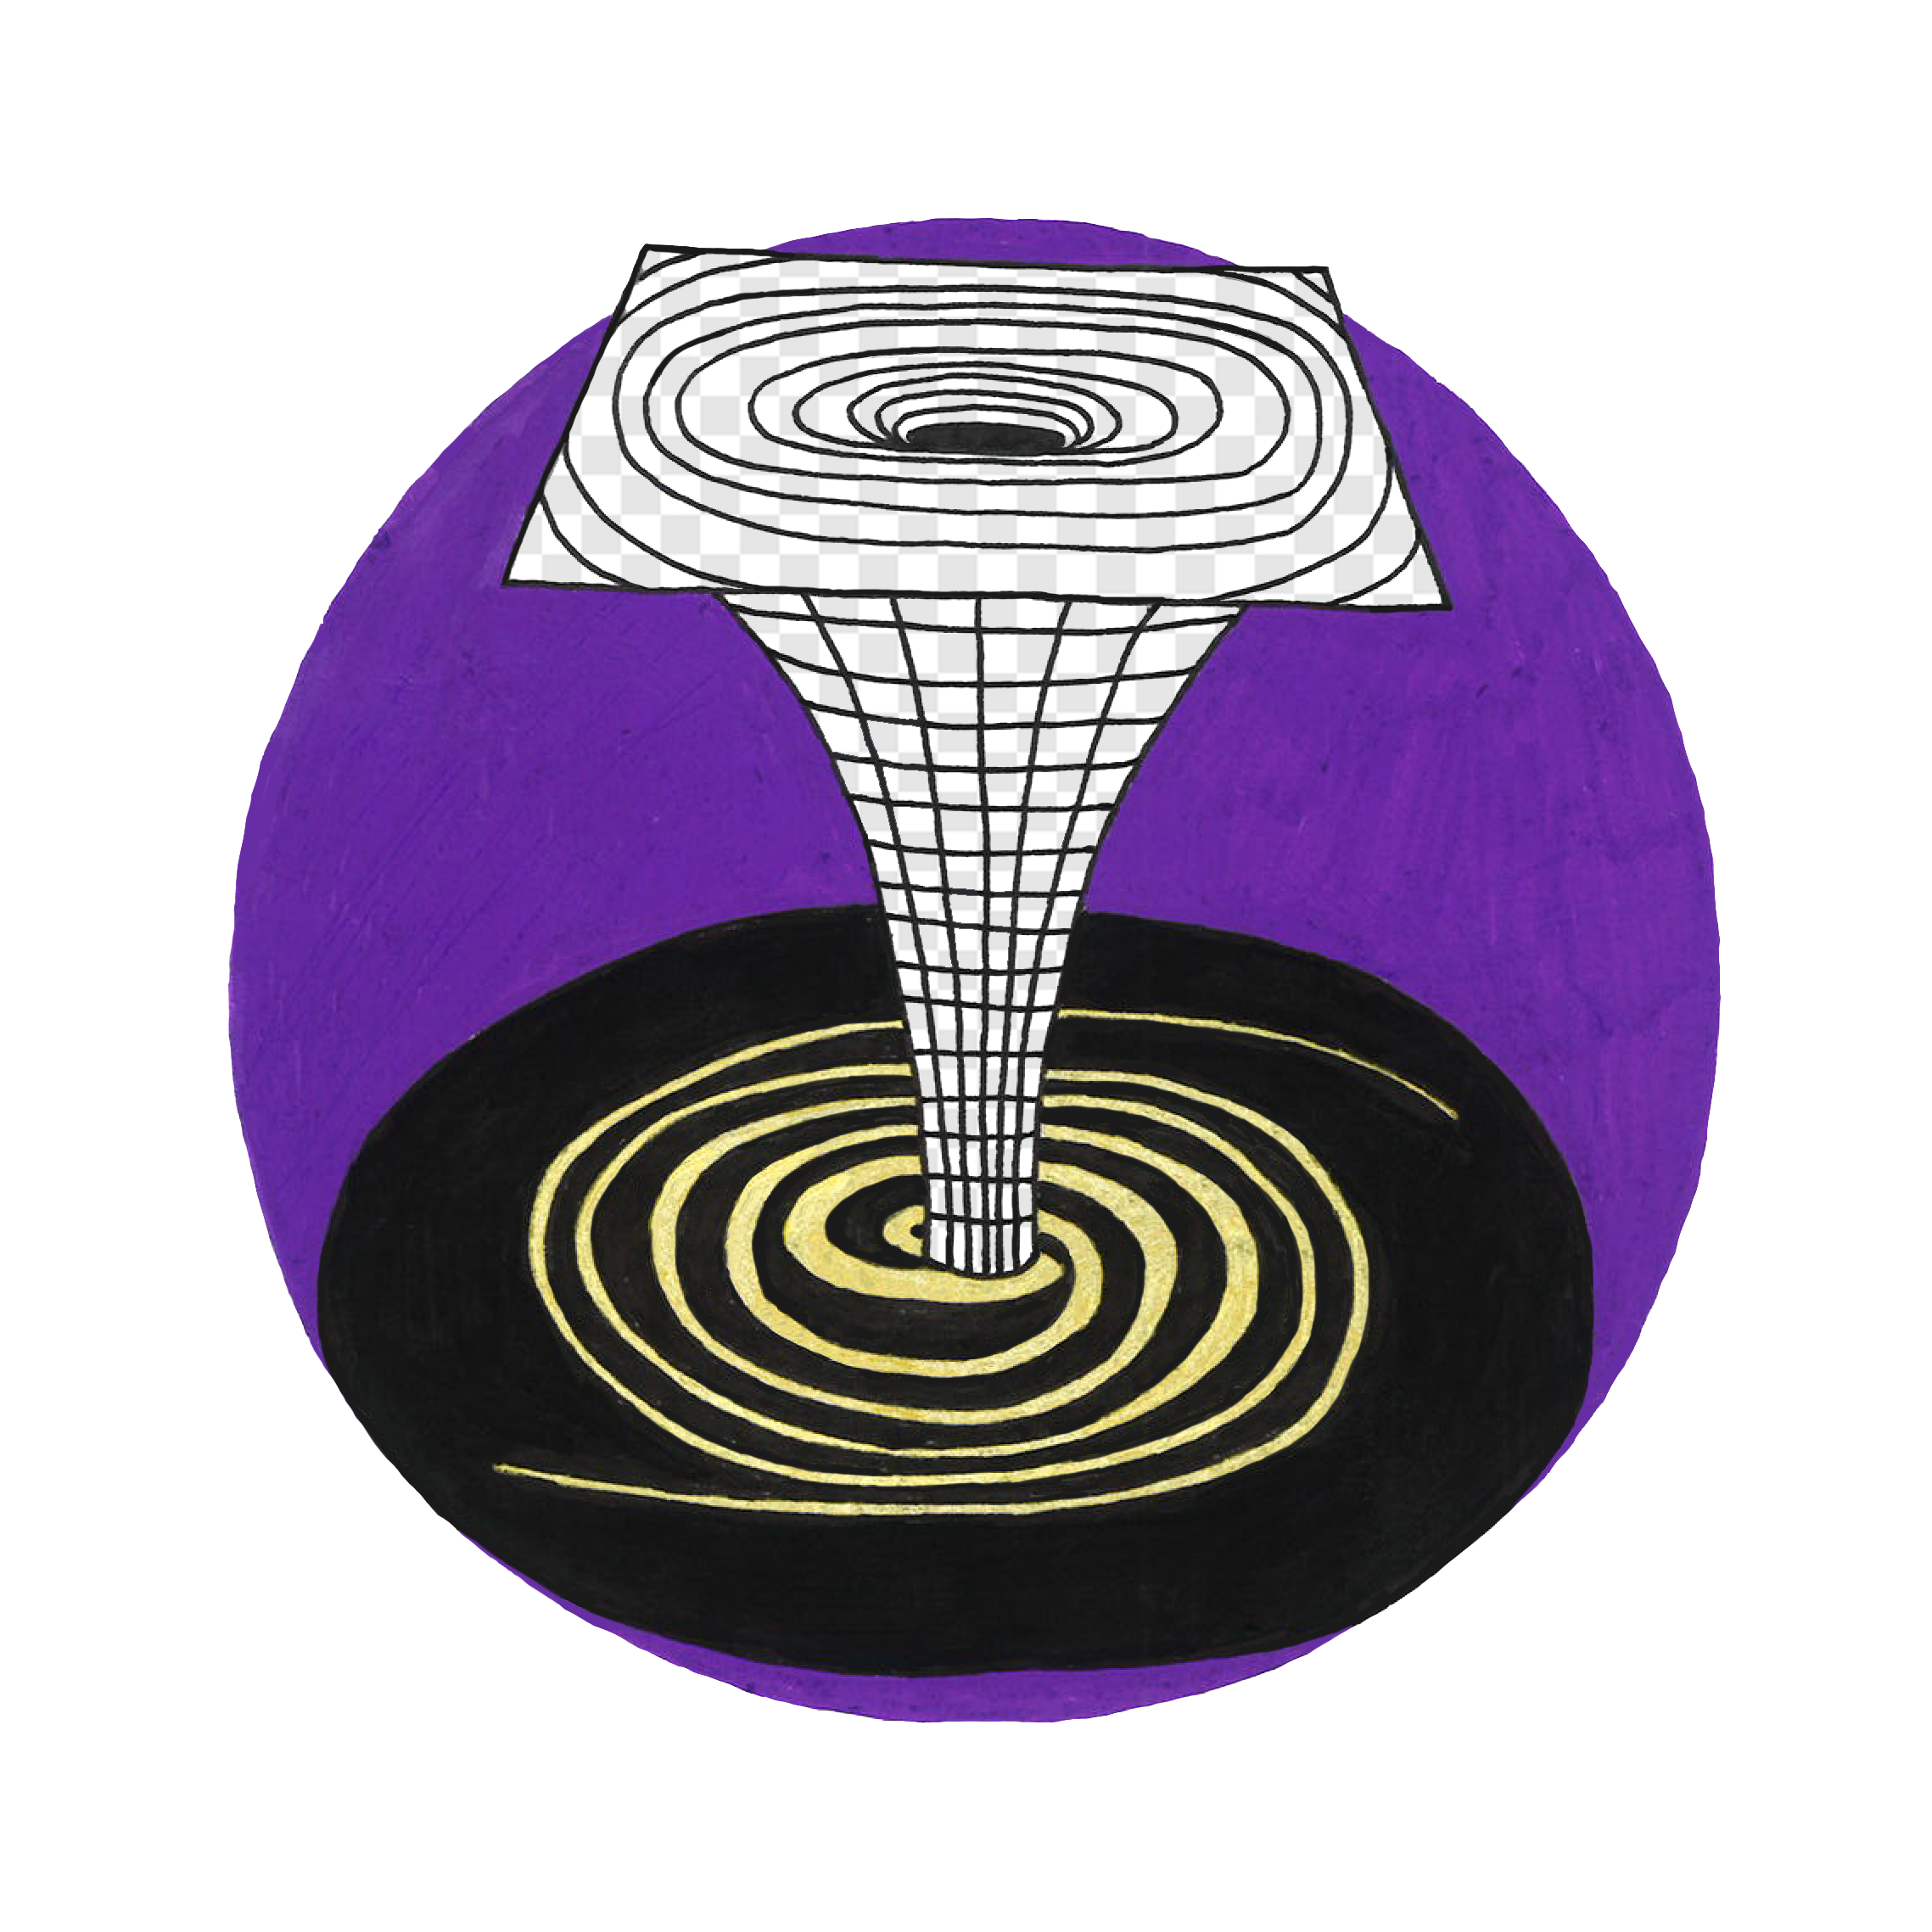
BLOG of an astronomer
I strongly believe in extraterrestrial life. There is life out there, somewhere in the universe.
It is only a matter of time before we will find it.
A good way to start is by searching for life on Earth. This is what I do in my daily life:
look for signs of life on the Earth. With this we build a model of the Earth as an exoplanet.
Ever since the first detection of a planet outside our solar system, our hope to find life on an other planet has been increasing.
However, to detect life we need high-tech instruments and systems can carry out a series of
steps to know what we are looking at. Observatories are at the moment looking for planets that
look similar to the Earth. ••• In my project I will start with something that we all know,
our own Earth, the only planet for which we know there is life. Starting off with existing research, models and instruments
I will work on an instrument that can measure (signatures of) life on Earth. The ultimate goal is to send the instrument
into space and look back at the Earth to make an image of how the Earth, with its life, looks like from space.
Do you want to go back to my homepage? Click here
Posts from December 2022
From leaf cell to tree canopy scale
How to model vegetation on Earth
Can we measure life on exoplanets? Well this firstly depends on our definition of life. Well, plants are definitely crucial for all life on Earth. So, maybe we can change our question to: Can we measure plants on exoplanets? To answer this question we have to study and understand how we can detect vegetation on Earth. Only then we might be able to understand how vegetation would look like on planets located at astronomical distances and most importantly: what instruments do we need to detect vegetation on planets outside our solar system?
Since I will be focussing on detecting vegetation, I would like to gain more knowledge about plants in general. Biology was not a mandatory course for me during high school. This means that I only have basic knowledge regarding leaves, plants, trees and nature in general. What I do know is that plants play a major role in the history of our planet Earth. They harvest solar radiation and convert it into chemical energy by means of the process of photosynthesis. As a result, they reduce atmospheric carbon dioxide concentrations, increase oxygen levels and therefore basically produce indispensable fuel for almost all other life on Earth.
In addition to acting as fuel, plants accelerate Earth's water cycle due to the so-called transpiration process. Basically, its a kind of... sweating. What what?! Well, plants absorb water in liquid form through their roots and release this same water as water vapour into the atmosphere though small stomata on their leaves. Only a small amount of the water remains within the plant.
Ok, cool, so I do know a bit about plants. But how can I further expand my knowledge? Luckily, as a researcher nowadays it is rather easy to build collaborations connecting multiple disciplines and institutes. Last year, I was able to connect with the Institute of Environmental Sciences. They created this amazing computermodel that simulates the absorption, reflectance and transmission of sunlight as soon as it hits the surface of a plant.
Using this model we can calculate remotely sensed spectral signatures of plants from outer space. In the coming weeks I will be thinking about which model scales would be interesting for my research, what types of plants I need to simulate and the importance of temporal changes, like winter and summer or sun and shadow.
- Model scales: the scales for which you can model vegetation go all the way from microscopic to macroscopic scales. You can model the scattering of light between features as small as individual cells or molecules within leaves or as big as scattering between multiple leaves on tree branches. We are even able to simulate forests by adding multiple trees together.
- Types of plants: we can model specific species of plants into great detail. However, we see an average of different types of plants when observing green patches on the Earth's surface from outer space. For some locations we might not have a clear view on what type of plants we will see. Therefore, we need to consider to calculate several general averaged signals of vegetation for different locations on Earth.
- Seasonal changes: the seasons have a big influence on vegetation, and therefore on the spectral signals we would be able to detect from outer space. In the spring the leaves (and soil) contain more water whereas in the summer leaves might be very dry. When it comes to modelling individual leaves, these specific details regarding the water content as well as plants standing in either the full sun or shadow become very important.

Posts from November 2022
Rollercoaster (PhD) life
Crazy highs and lows, up and down, time after time
"Here we go, On this roller coaster life we know, With those crazy highs and real deep lows, I really don't know why". A song by the Dutch singer, Danny Vera, who describes the daily life of every human being on this pale blue dot, the Earth. Life is like a roller coaster, as it allows you to go up and down. But in this blog I do like to relate everything to my personal PhD life. And guess what, it also feels like a complete rollercoaster.
Everything starts with choosing the nicest amusement park in the world. Visiting the websites of random amusement parks all over the globe allows us to compare and investigate all their highlight attractions. In the end, choosing only one out of about a hundred locations will always be very difficult. I took me a while to make a shortlist of astronomical institutes all over the world . Or let's say, of those that were actually appealing to me. In general, I like to prepare myself well before making an important decision. However, even with the best possible preparation, starting a career in academia would bring a lot of surprises and insecurities.
The first moment that I start to feel nervous is when I start to queue for the highlight of the amusement park: the rollercoaster. More and more signs revealing relevant information are popping up once you are getting closer towards the entrance. The final sign before walking through the queue doors is: "Please, enjoy the ride". When I was getting ready for my first working day, I had this same feeling of excitement mixed with s a tiny bit of fear. I knew what to expect from starting a PhD, but at the same time, I had no clue . I received multiple emails with information about my new university account, some contract details and even an email stating: "Welcome at the Leiden Observatory".
When finally reaching the entrance of the rollercoaster, you start to become even more excited about the ride to come. You are being asked to line-up in front of one out of the many rollercoaster carts that are waiting of you. This moment gives you the opportunity to get a first impression of all the other people that are also joining the same ride. The start of your first day at the research institute mainly consists of meeting other PhD students from the same intake. During a number of activities you start to get to know each other and become familiar with the working place.
Slowly the sound of the chains taking the carts upwards is getting closer. A first shock connects your cart to the gears and there you go.. Upwards.. As you are looking forward, the sky is getting closer, while looking backward the ground only gets smaller. You are able to scan the rest of the area, overseeing the entire park. Your nerves are starting to cool down once you are able to overlook over the rest of the coaster trail. The road seems predictable and the exit feels near. During the first half of your PhD you slowly start to get to know the research field you are working in. The more knowledge you accumulate, the more complete the layout of your thesis and therefore career path becomes. You have much energy to start various projects simultaneously as well as join several collaborations and prepare for talks and conferences that help you to promote your research.
Then all of a sudden you can not hear the sound of the chains anymore. You have reached the highest point of the ride. Looking ahead of you, there is only the beating of your heart that you feel in your throat. Before you realise, the carts accelerate as you are being pulled down by gravity. This is exactly the point that I experience at the moment. I am just over halfway through my PhD. I recently found out that some of the (too many) projects that I started these years, are not (all) going to be finished. The structured planning that I made for myself at the beginning of my PhD was far from realistic. At the same time, I need to start thinking about the next steps in my career. Do I want to continue in academia, with whom, where and in which field? Scary times, going down.. But, I do know that as soon as I get a new grib on my projects, I will go up again.
A PhD is a rollercoaster of emotions. I do think that everyone has to be aware of this fact before starting it. You almost never completely control the ride, as you are very dependent on other researchers as well. Whether this is your research group, your supervisor or even an electrical engineer that is helping you out with your instrument. The most important thing, is to never stop believing in yourself. Do never loose your curiosity in 'things', and above all, enjoy the ride as much as possible.

Posts from August 2022
Spectropolarimetry of life
Measuring life from a hot air balloon
At the moment, I am in the United States and I have just presented my very first talk at the SPIE conference. How exciting, spending 20 minutes to tell people whom you have never seen before about the work you have been doing. In this blog, I will briefly explain what I presented.
Many astronomers spend a lot of time looking at the light coming from stars. We can separate the light from our Sun, the closest star, into its own light spectrum. The Sun emits ultraviolet, visible and infrared light. Because of this visible light we are able to see all the colours of the rainbow.
In an earlier blog I mentioned that sunlight ensures that we have oxygen (photosynthesis) and ozone (reaction of sunlight with oxygen molecules) in the atmosphere on Earth. We can recognise these tiny molecules when we look at the colourful solar spectrum on Earth. The molecules absorb specific parts of the light, creating thin black lines in the spectrum.
When sunlight has traveled through the atmosphere and hits the Earth's surface, some of the light is reflected back towards space. Using satellites, we can find out some of the properties of the surface by measuring this reflected light.
More specifically, we actually can determine whether the surface has any plants growing on it or not. Now you may think, that's not so difficult because most plants are green. Therefore I should be able to recognise vegetation by eye as well. Well, the reason that we can identify plants had certainly something to do with the plants being 'green'. More precisely, it has to do with the fact that chlorophyll molecules are responsible for plants being green. Chlorophyll molecules absorb the blue (485 nm) and red (700 nm) parts of sunlight and reflect the green (550 nm) part. This is why most plants have a green colour. After a strong absorption in the red part of the spectrum, we see a very sharp reflection on the molecules in the infrared (765 nm). This is what we call the "vegetation red edge". By looking at the ratio between the reflections of red and infra red light, we can determine whether a satellite was looking at actual living plants.
In May, I spent some time in Switzerland carrying out some fieldwork! We wanted to see whether we were capable of observing life(!) on Earth with our own instruments. A few hours before sunset, we drove up to the Freiburg region where we took off in a hot-air balloon in the middle of a meadow. This was so awesome! The basket of the balloon was so big that the instrument together with 5 extra passengers could fly. During the inflation of the balloon, additional people had to step into the basket to prevent the balloon from taking off with our instrument already on board.
Within 15 minutes the balloon was inflated, and off we went. Within a fraction of a minute, the leaves on the trees were already too small to be recognised. There was no time to appreciate the view, as we were very busy taking measurements! Our spectropolarimeter pointed to the earth's surface and recorded the reflection of sunlight on all sorts of different surfaces. With these measurements, we could eventually determine whether or not there was life on Earth. And guess what! We did find life! In October, we will travel once again to look for even stronger signs of life. I will keep you posted!

Posts from June 2022
Portret of Sagitarius A*: the black hole in our Milkyway
Taking photographs of giant but invisible objects
Gigantic heavy objects occupy the centres of galaxies. All the objects in the universe have a gravitational force that is proportional to their individual masses. A weight can be so heavy that the attraction is so strong that it even prevents light and the smallest particles from escaping falling towards the object. Those objects have been called black holes by astronomers.
Actually, the name black hole is quite odd. The colour "black" means that we cannot see any visible light around the object. It's a bit like looking for a well when it's dark. If we cannot see anything, we cannot tell if there is a well nearby. But then, how did we ever find out that black holes exist if we cannot see them?
A hundred years ago, Einstein predicted the phenomena of black holes with his (special) theory of gravity. He described gravity in itself not as a force but as a curvature of space. This curvature would be a consequence of the existence of a mass in space. The heavier the mass, the greater the curvature. An object with a gigantic mass therefore creates very strong curves. These can become so steep that no object close to the mass can escape: everything falls towards the mass into a big black hole.
Three years ago, researchers achieved the impossible. With seven large radio telescopes spread across the globe, they joined forces to form a radio telescope the size of the earth. This telescope has an incredibly sharp resolution and can see far enough to observe the centre of galaxy M87. For decades, astronomers have suggested that a super-massive black hole is hiding in the centre of M87. And nothing could be further from the truth: in April 2019, astronomers presented the ultimate proof of Einstein's theory: the very first photo of a gaping black hole.
M87 is not the only galaxy with a black hole. Since the 1980s, it has been clear that a large, mysterious, invisible source is hiding in the centre of the Milky Way. The object is called Sgr A*. Stars near the centre rotate in gigantic arcs around the same point. Their movements are monitored in great detail. There is one particular star that is receiving particular attention: S2. In 2002, S2 was found to be at the point closest to Sgr A*. By adding this point to the models, astronomers can estimate the size of the source. It turned out to have the mass of 4 million suns. The only object that could be that heavy without emitting any light would be a black hole.
It is expected that at the centres of all large galaxies in the Universe there are gaping black holes. They swallow up hundreds to thousands of stars the size of the Sun (in mass) every year. A massive amount! Fortunately, we don't need to be afraid of these black holes. They are so incredibly far away from us that if we could fly a spaceship at the speed of light, it would still take us 27,700 years to get to the nearest black hole!

Posts from April 2022
Polarisation: From a concoction to global application
Understanding of the biggest and the smallest
Polarimetric measurements allow astronomers to learn much more about astronomical objects than only their brightness. In regular telescope only measures the intensity of an object in a specified wavelength range. However, if we would be able to measure the polarisation of the light simultaneously, we can look at characteristics of astronomical object that otherwise would be hard (or impossible) to measure.
- Massive stars end their lives with a powerful and luminous explosion that forms what is known as a supernova. Since 1970, astronomers have been trying to measure the polarisation of supernovae. This can be used to determine the intricate details of the explosion. For example, by measuring the polarisation of the emitted light, asymmetries in the shape of the expansion of the stellar remnant can be detected.
- In 2002 a team of astronomers detected polarisation of the oldest light in the universe: the cosmic microwave background. Theoretically, this polarisation was expected to be present according to the theory of inflation: the unimaginably large expansion of the size of the universe during a tiny fraction of a second after the Big Bang. By studying the polarisation of this background, astronomers are trying to understand more about the very first seconds of our universe.
- Polarimetry allows us to measure light coming from very faint sources. Black holes, the most massive objects in the universe, do not emit light. However, in 2019 a team of researchers did the unthinkable: image the shadow of a black hole in galaxy M87. This could only be done by combining many radio telescopes all over the globe into a world-wide network. Short after, in 2021, the team discovered that a significant fraction of the light in this image is polarised. This allows astronomers to map the structure of the material around the black hole.
- 2021 was a fruitful year for polarimetry. Yet another team of astronomers managed to measure polarised light from a disk of dust and gas around a gaseous exoplanet using the SPHERE instrument. These measurements eventually provide understanding of the formation of the planet and possible moons. In the future, polarisation measurements of rocky planets allow us to obtain more information regarding their atmospheres and surfaces to eventually look for possible signs of life.
How do we actually measure the polarisation of light? • Let’s have a quick recap on the observing technique behind polarimetry. To identify polarized light, we use filters that only passes through light with a particular direction of polarisation; so-called polarisers. Just to be clear: whenever we say that light behind a polariser becomes polarised, there is no physical change in the polarisation of the light. The light obtained a preferred polarisation direction because of filtering out other directions. As a direct consequence, unpolarised light passing through a polariser only leaves 50% of the intensity of the incident light.
Instruments that measure the polarisation of light use two polarisers. The incoming light is equally split into two beams. One passes through a horizontal polariser as the other goes through a vertical polariser, producing two images. By subtracting one image from the other, the remaining unpolarised light is cancelled from the resulting image. This helps astronomers to search for the polarised scattered reflection of exoplanets since the resulting image removes the unpolarised glare of the starlight.

Posts from March 2022
We do not know anything for certain, but everything probably
Polarisation: From a concoction to global application
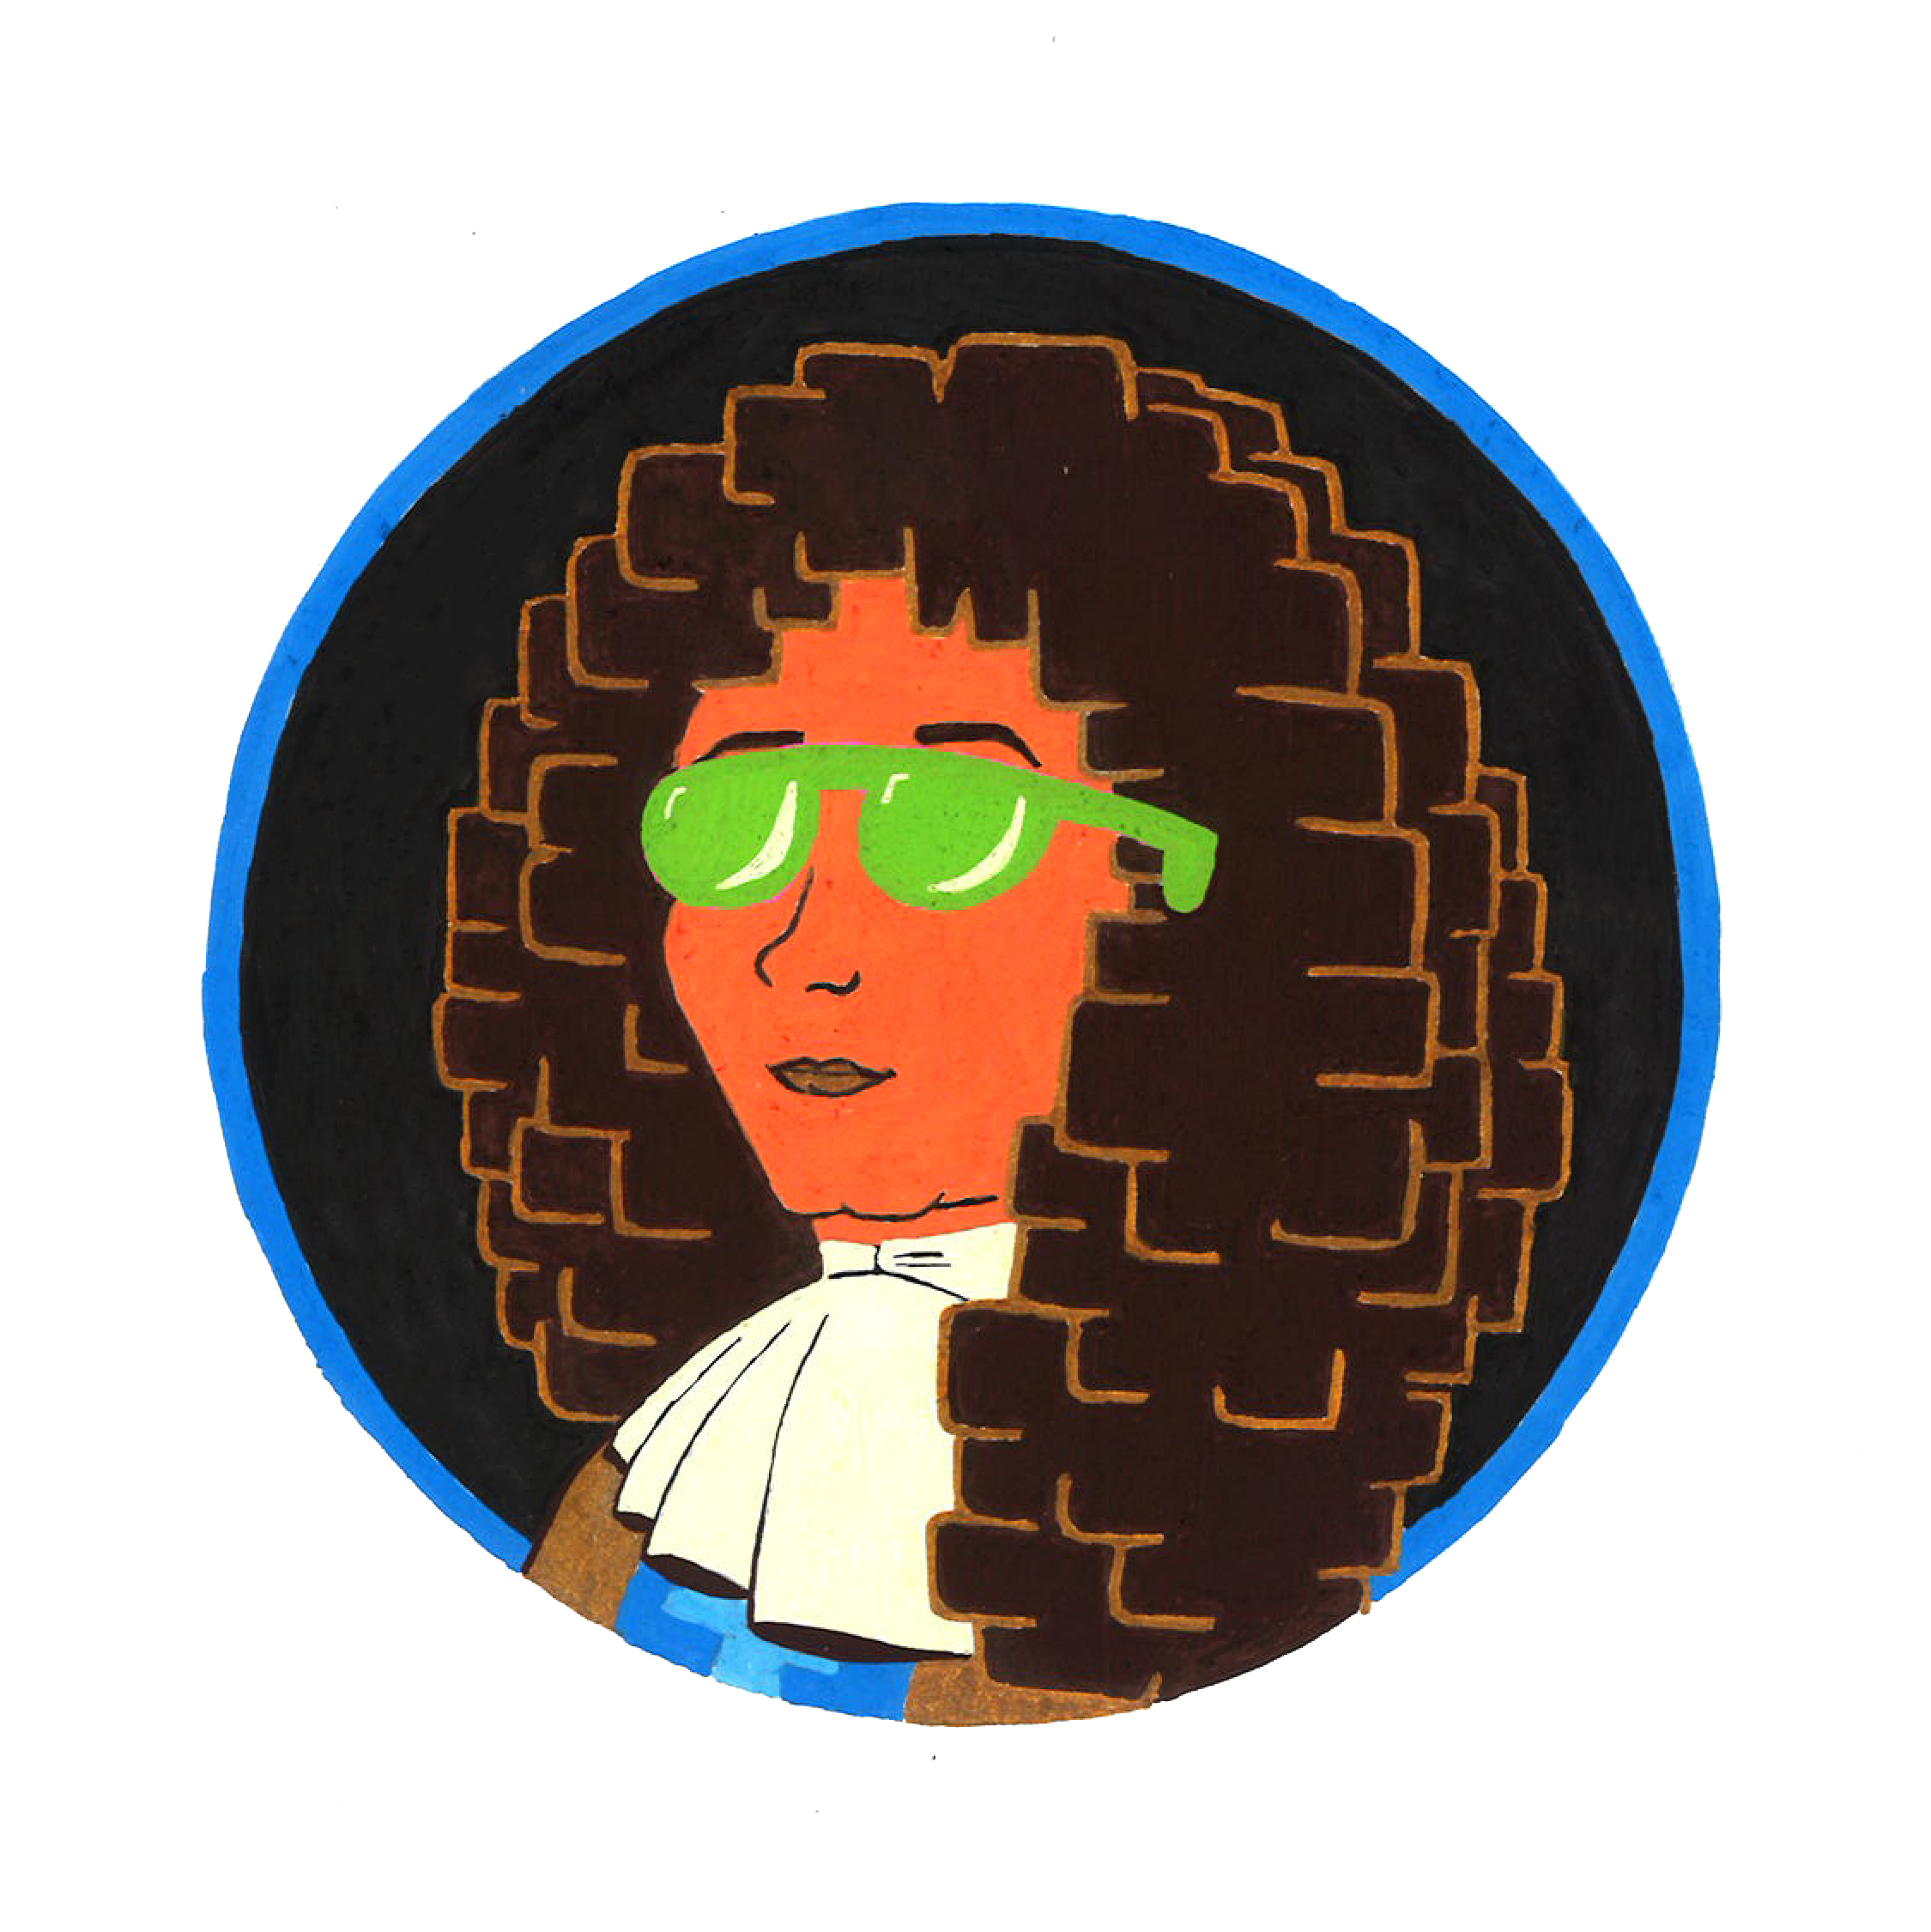
As a scientist, you are so focused on discovering something new that you sometimes forget what preceded to your own research. I noticed this when talking to the editor of het Klokhuis. They were preparing an episode dedicated to Christiaan Huygens, a well-known Dutch astronomer of the 17th century. He was the first to write down his thoughts about the existence of life beyond our Earth in his book Cosmotheoros. If only he had known that his discovery of the polarisation property of light would help us in the quest for extraterrestrial life.
As a Dutch inventor, mathematician, naturalist and astronomer, Huygens was one of the most important scientists of the 17th century. With his "Traite de la Lumiere", his theory of light clashed with the hypothesis of Isaac Newton. Newton described the phenomenon of light as moving small particles with their own mass. Huygens did not agree. He described light as a light wave. In modern physics we describe light by using Huygens theory. We also say that light consists of small particles (photons) that travel at the speed of light. However, these particles do not have mass.
Huygens is an important ancestor of my research. In addition to the philosophical notion of life beyond the earth, he described the refraction of light into two beams by means of a calcite crystal. Both rays that escape from the crystal are linearly polarised. Now you may start to understand why his theories are essential to my research: The search for life on and beyond the earth using the polarisation of light.
Polarisation of light as a known concept
For scientists, it is currently easy to explain the concept of the polarisation of light. Almost everyone uses this invisible property of light on a daily basis. The theory and science is hidden in e.g. polarised sunglasses and LCD screens. Even in the screen of your smartphone you will find an application of polarisation. Then it shouldn't be so tricky to understand... Right?
Well, being a researcher, I can say that it is very difficult to define and explain something that you do not yet understand. For this reason, I would like to dive back into some history of the polarisation of light. How did we progress from discovering the polarisation of light to its applications which I use every single day in my life as an astronomer.
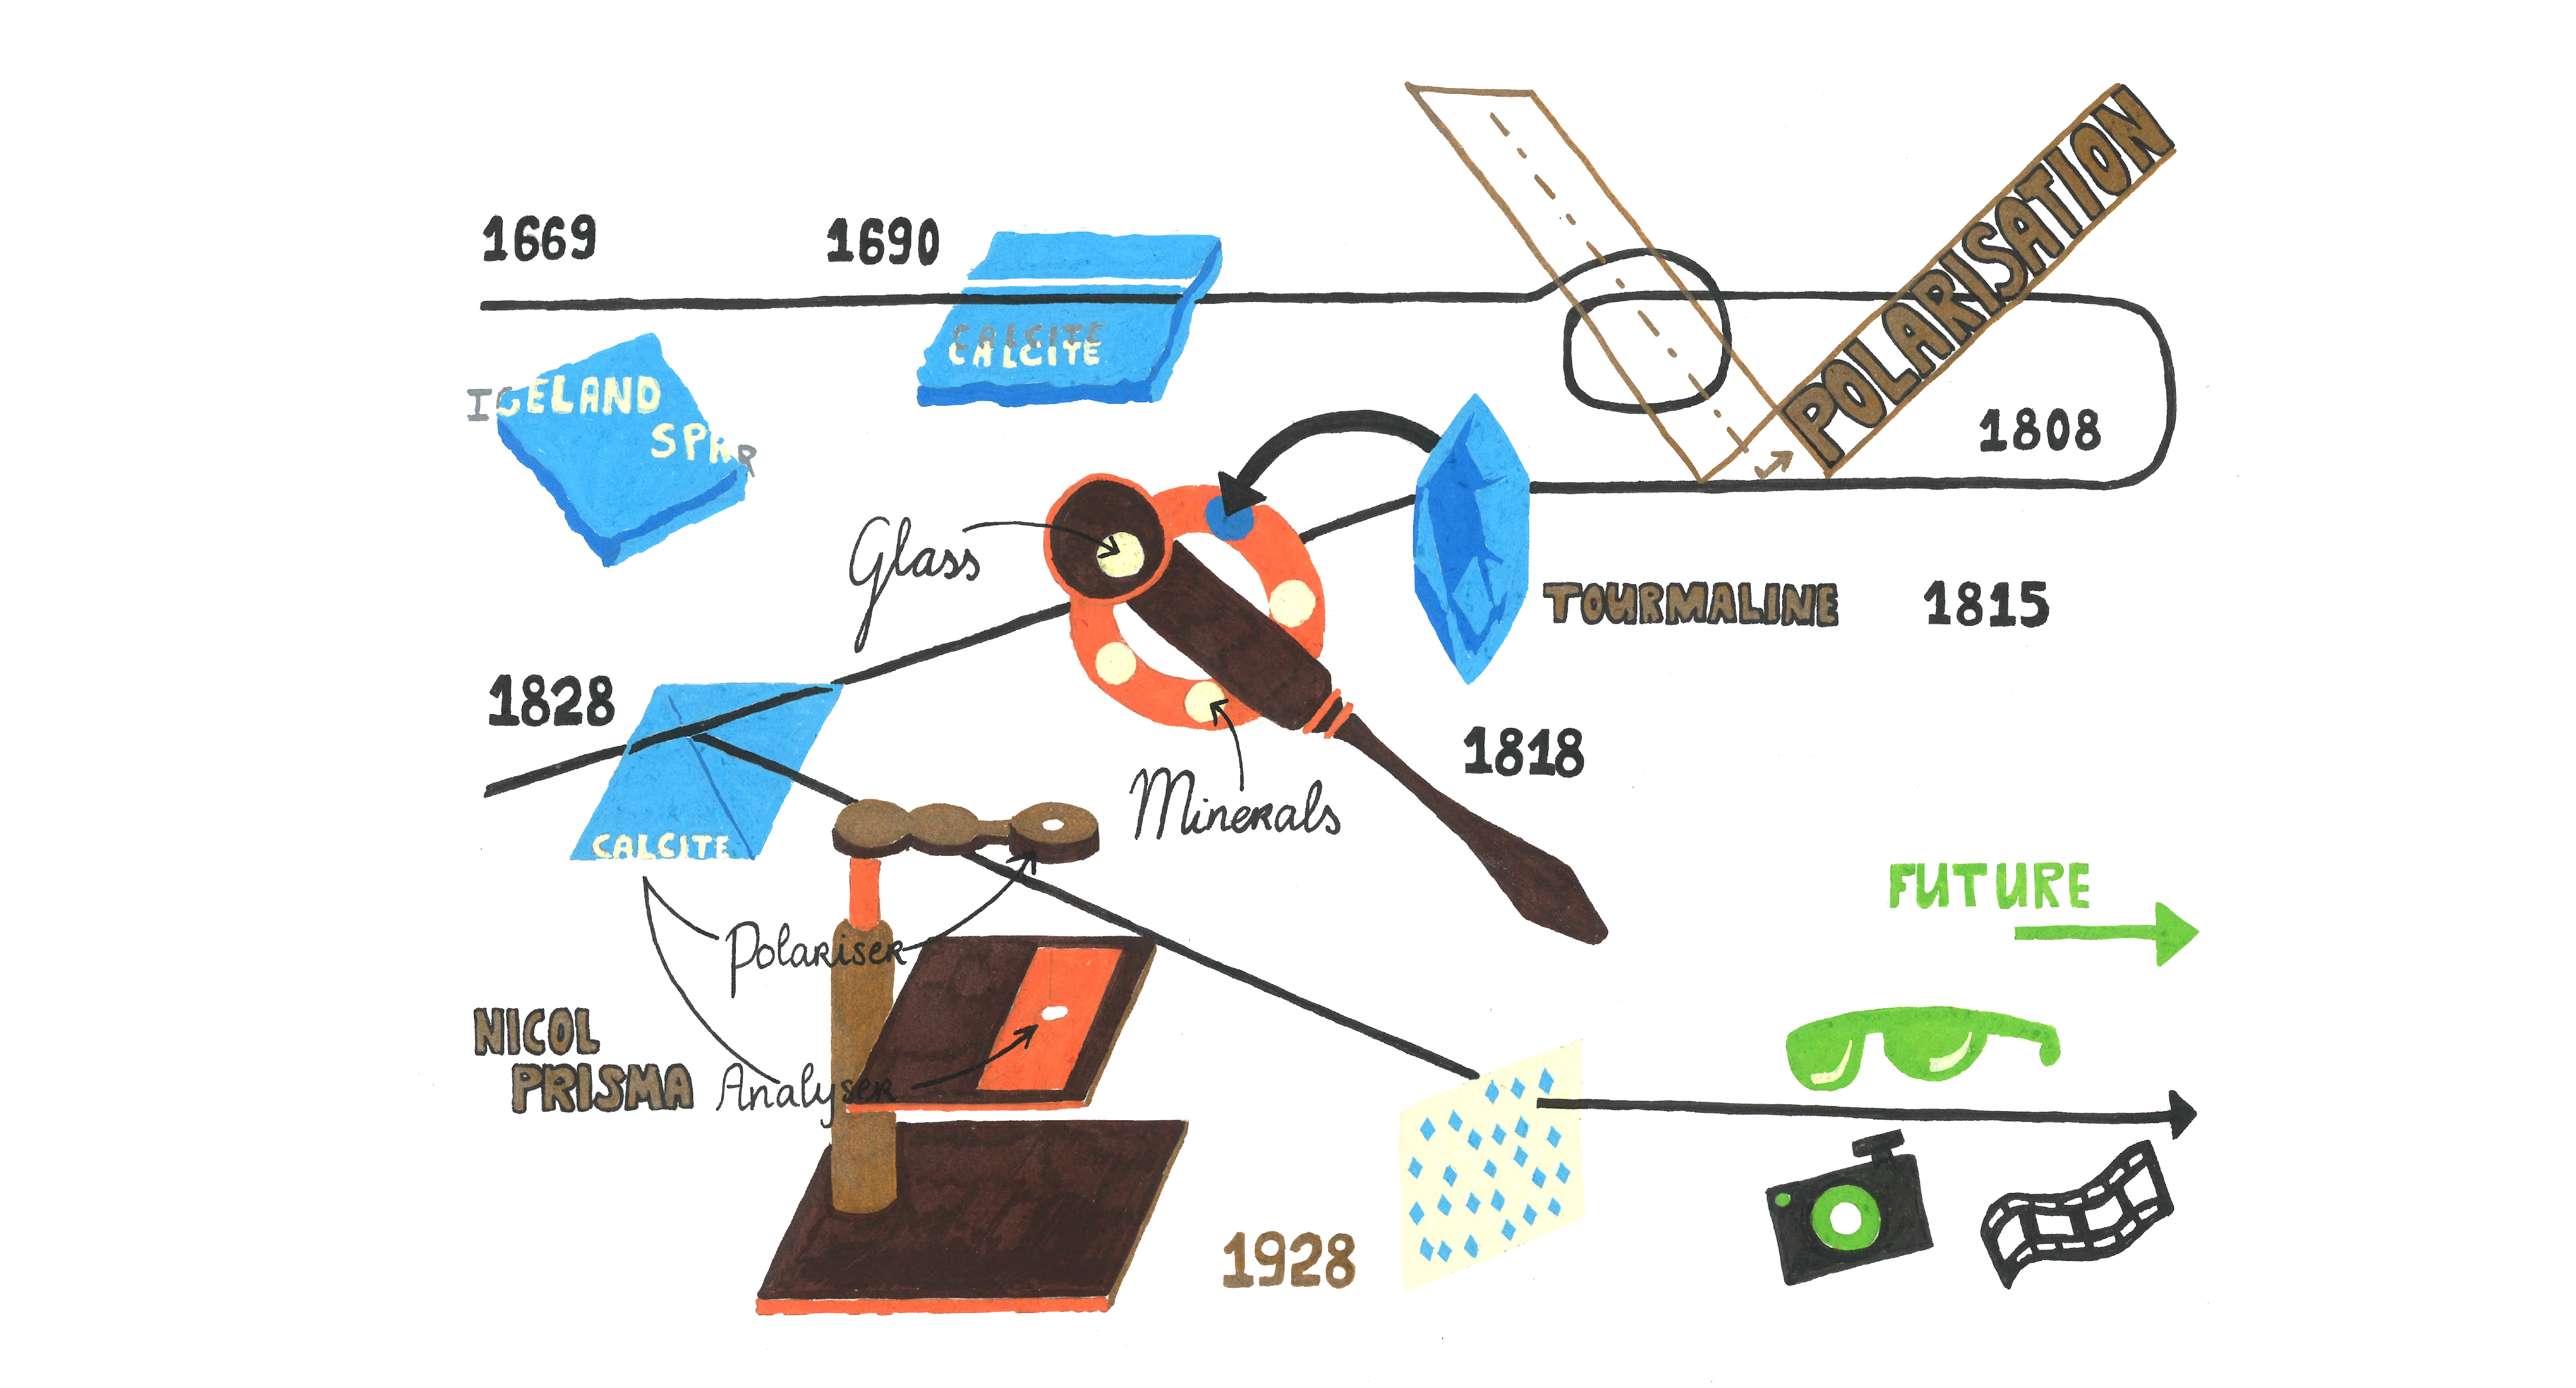
From Huygens' discovery to thin polarising plates • The history of polarisation actually begins with Erasmus Bartholinus. In 1669 he observed the natural phenomenon of double refraction of light in Iceland spar. At that time, however, Bartholinus knew nothing about the phenomenon of polarisation.
Almost twenty years later, Christiaan Huygens discovered the fundamental phenomenon of polarisation in a different material than Bartholinus, namely in calcite. He described the refractive natural phenomenon with his wave theory of light.
It was not until 1808 that Étienne Louis Malus discovered that reflected light becomes partially polarised. His observation provided a better understanding of the propagation of light. Malus was the one who introduced the word "polarisation" for the phenomenon.
A few years later (1815) Jean Baptiste Biot found out that tourmaline passes a polarised ray almost completely without disturbance while absorbing the other ray. David Brewster was the first to utilize this tourmaline as a polarisation analyser (1818). He designed the tourmaline tong that was used to inspect the quality of crystals. The principle of combining a single glass plate and a polariser as an analyser came to be known as the polariscope.
At the beginning of the 20th century there were many types of polariscopes. They all used a Nicol prism as polarisation analyser. A Nicol prism consists of two separately polished calcite prisms that are then glued together. The prism allows waves that vibrate in one direction to pass through it. As a result, it outputs a polarised beam.
In 1928, Edwin H. Land came up with the idea of combining millions of microscopically small herapathite crystals into a thin sheet. This was achieved by finely grinding the crystals and mixing them with a viscous plastic. The mixture was pushed through a thin slit and cooled down. Land called this thin and transparent sheet the Polaroid J-Sheet. Soon the sheets were used on a large scale in e.g. Polaroid sunglasses, car windows with a Polaroid film, filters for cameras and eventually even 3D films.
In the 1940s, the sheets were improved by using plastics consisting of long organic chains called polymers. During production, the sheets are simultaneously heated and stretched. This causes the polymers to lie parallel to each other which results in a strong double-breaking effect. In addition, the sheets became even thinner with this streching technique. Even today, improved versions of these sheets are still in use.
Did you enjoy following the history of Huygens discovery to thin polariser sheets in this way? In my next blog, I will describe a similar storyline, but this time that of the discoveries of the polarisation of light in the field of Astronomy. Stay tuned!
Posts from January 2022
How to search for planets outside our Solar System?
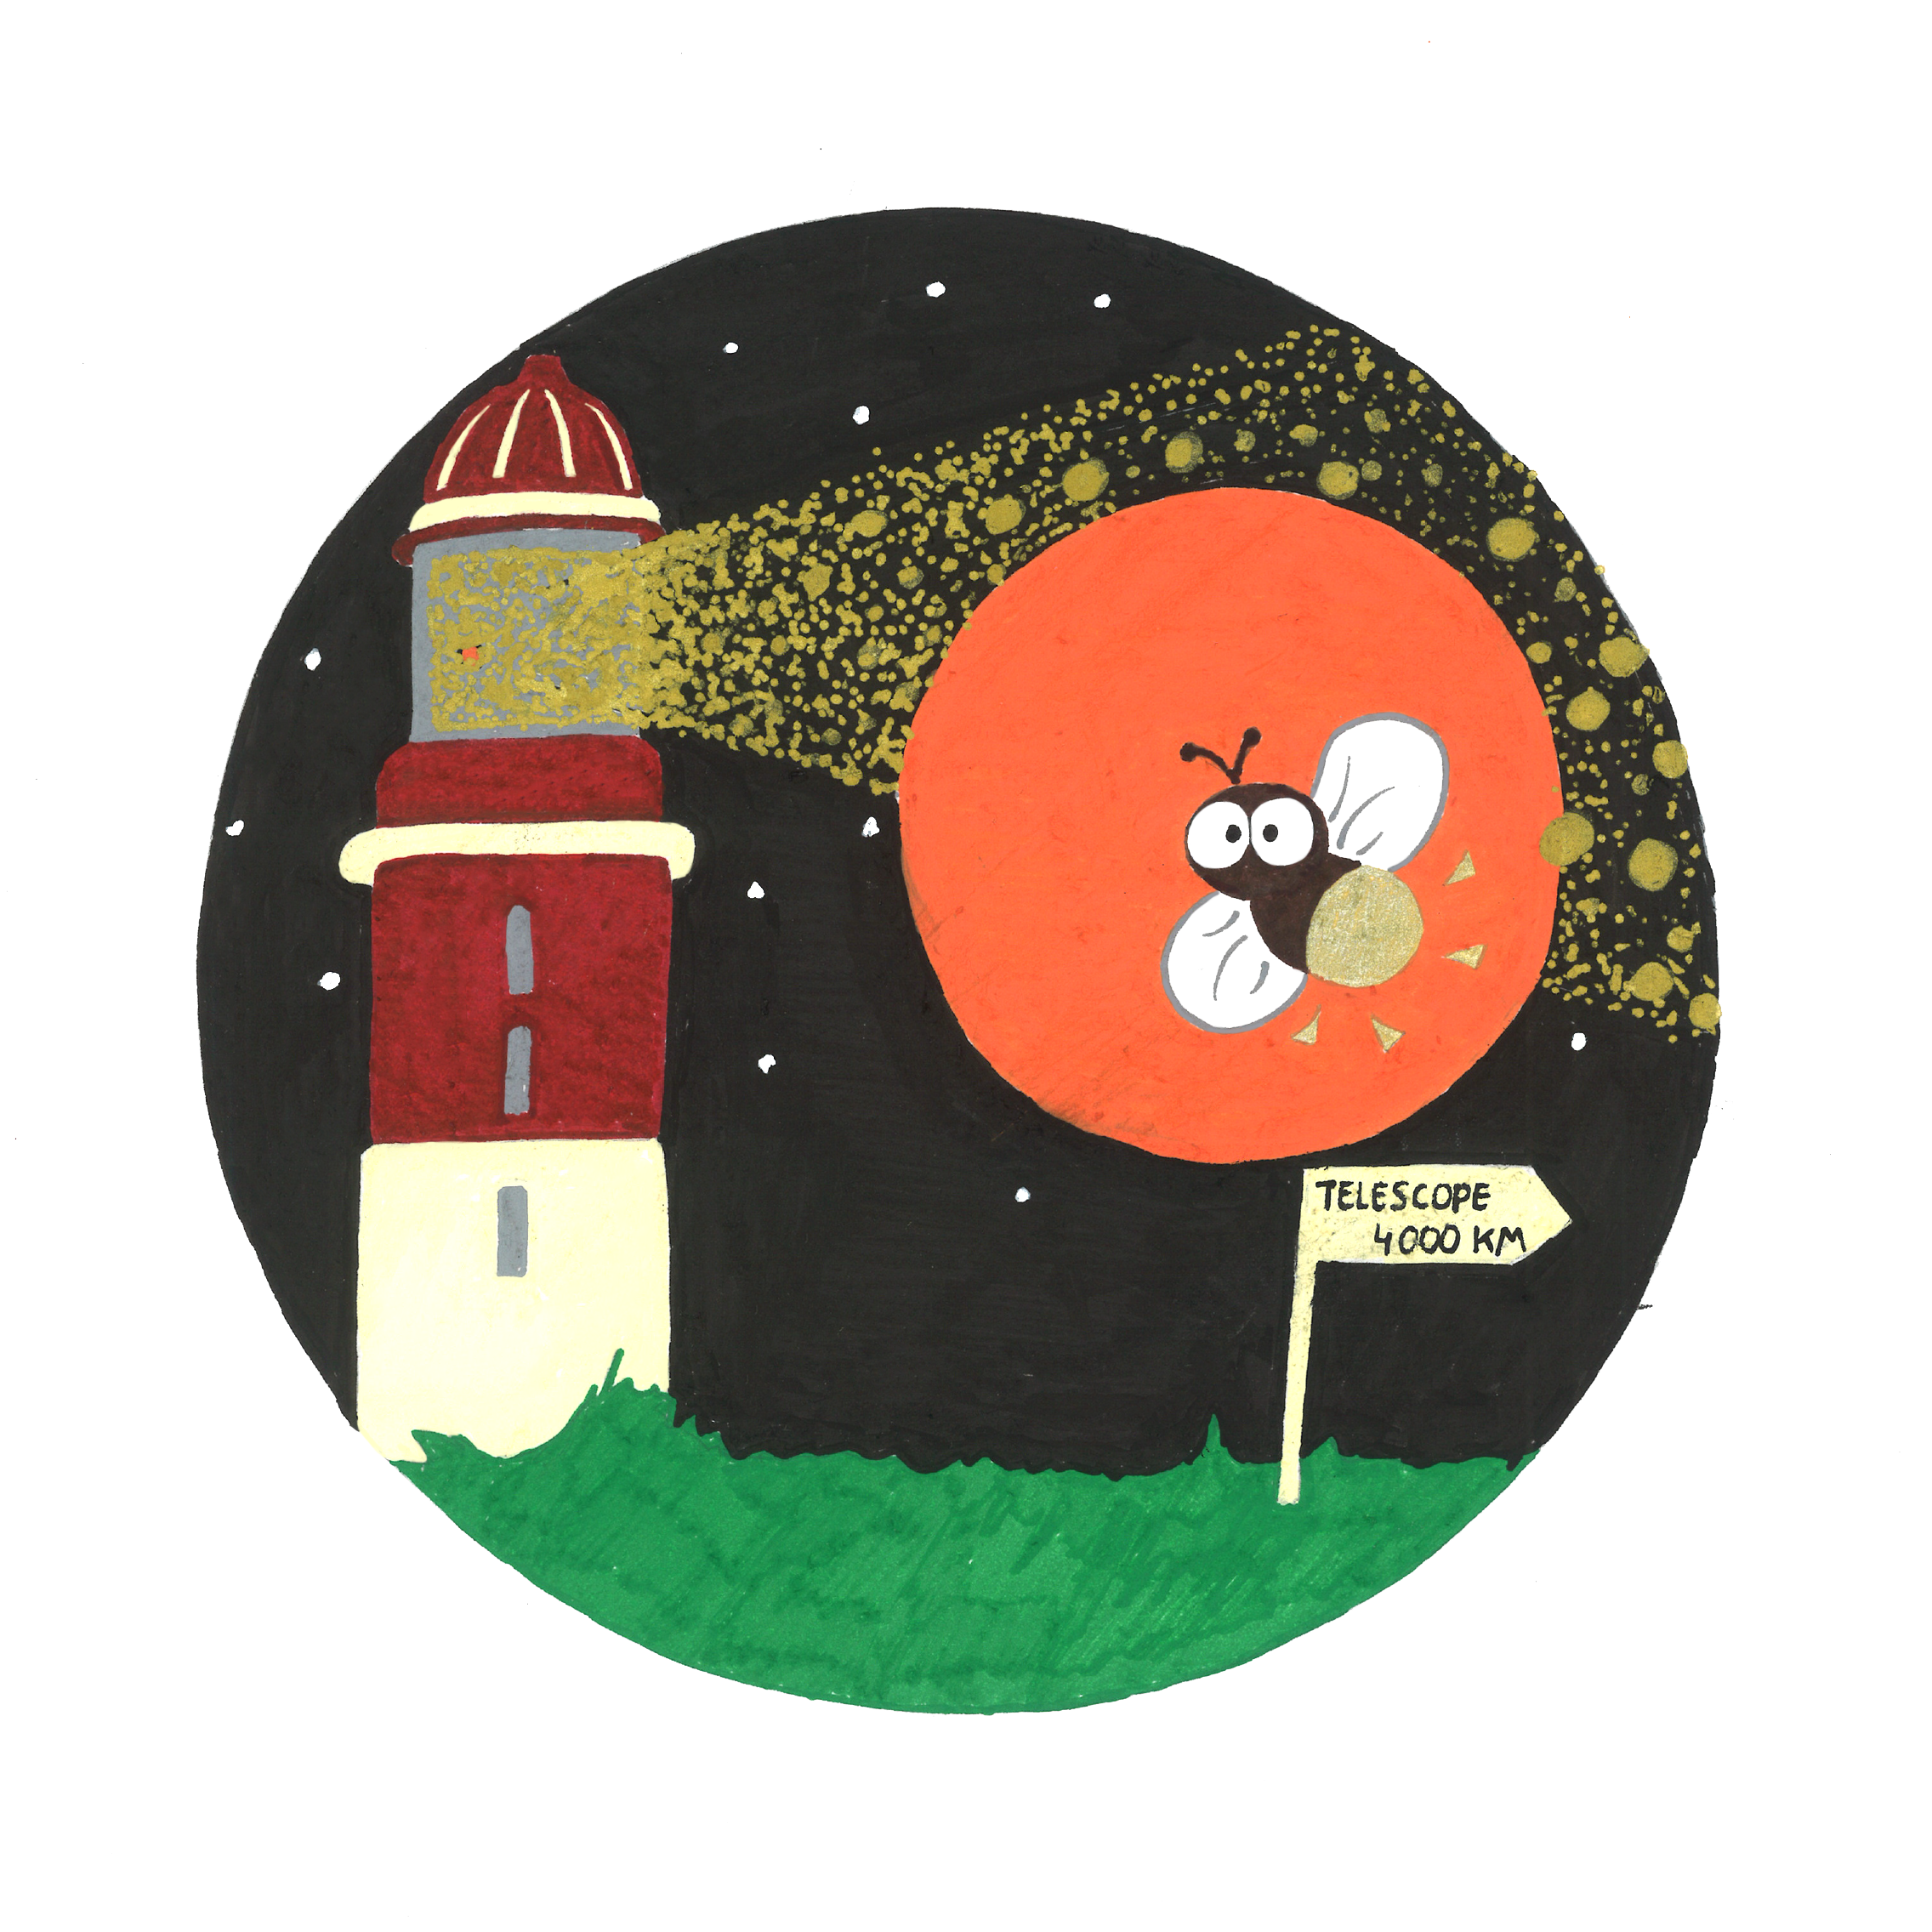
Looking for a tiny firefly near a lighthouse.
Last month I dedicated my blog to the launch of the James Webb Space Telescope. One of the main science goals of Webb will be to study the atmospheres of exoplanets to search for biosignatures; the so-called building blocks of life. This is super cool! But before this so called, characterisation, we first have to find these exoplanets. As this semester I am a teaching assistant for a course called High contrast imaging, I thought it might be nice to elaborate a bit more on how we can find exoplanets circling around stars far, far away from our Solar System.
If you paid close attention to the astronomy news, you might have seen the headlines mentioning “NASA's Transiting Exoplanet Survey Satellite (TESS) has identified more than 5000 potential alien worlds” But then how is the counter of confirmed discoveries of exoplanets by astronomers only at 4908? Well, to call a potential alien world an exoplanet we need a validation of its existence by at least two detection methods. When planets are identified by only one single detection, we call them exoplanet candidates.
There are two well-established detection methods;
- Transit method; when a planet is orbiting a star it dims the light of the star by a measurable amount when it is passing in front of the star.
- Radial velocity method; stars start to wobble around their system’s centre of mass due to (a) planet(s) that is orbiting the star.1
If you think about it: the two main detection methods mentioned above are both indirect detection methods. What I mean by that is that the planets are not detected by making a picture, but only thanks to the effect they have on their host star.
If there was only a way to dim the overwhelming glare of the star during an observation, we might be actually taking an image of the exoplanets themselves. This gives rise to another detection technique, so-called Direct imaging. We refer to the ratio of the star’s flux to the planet’s flux as the contrast ratio. This is why direct imaging is also known as High contrast imaging, or HCI.
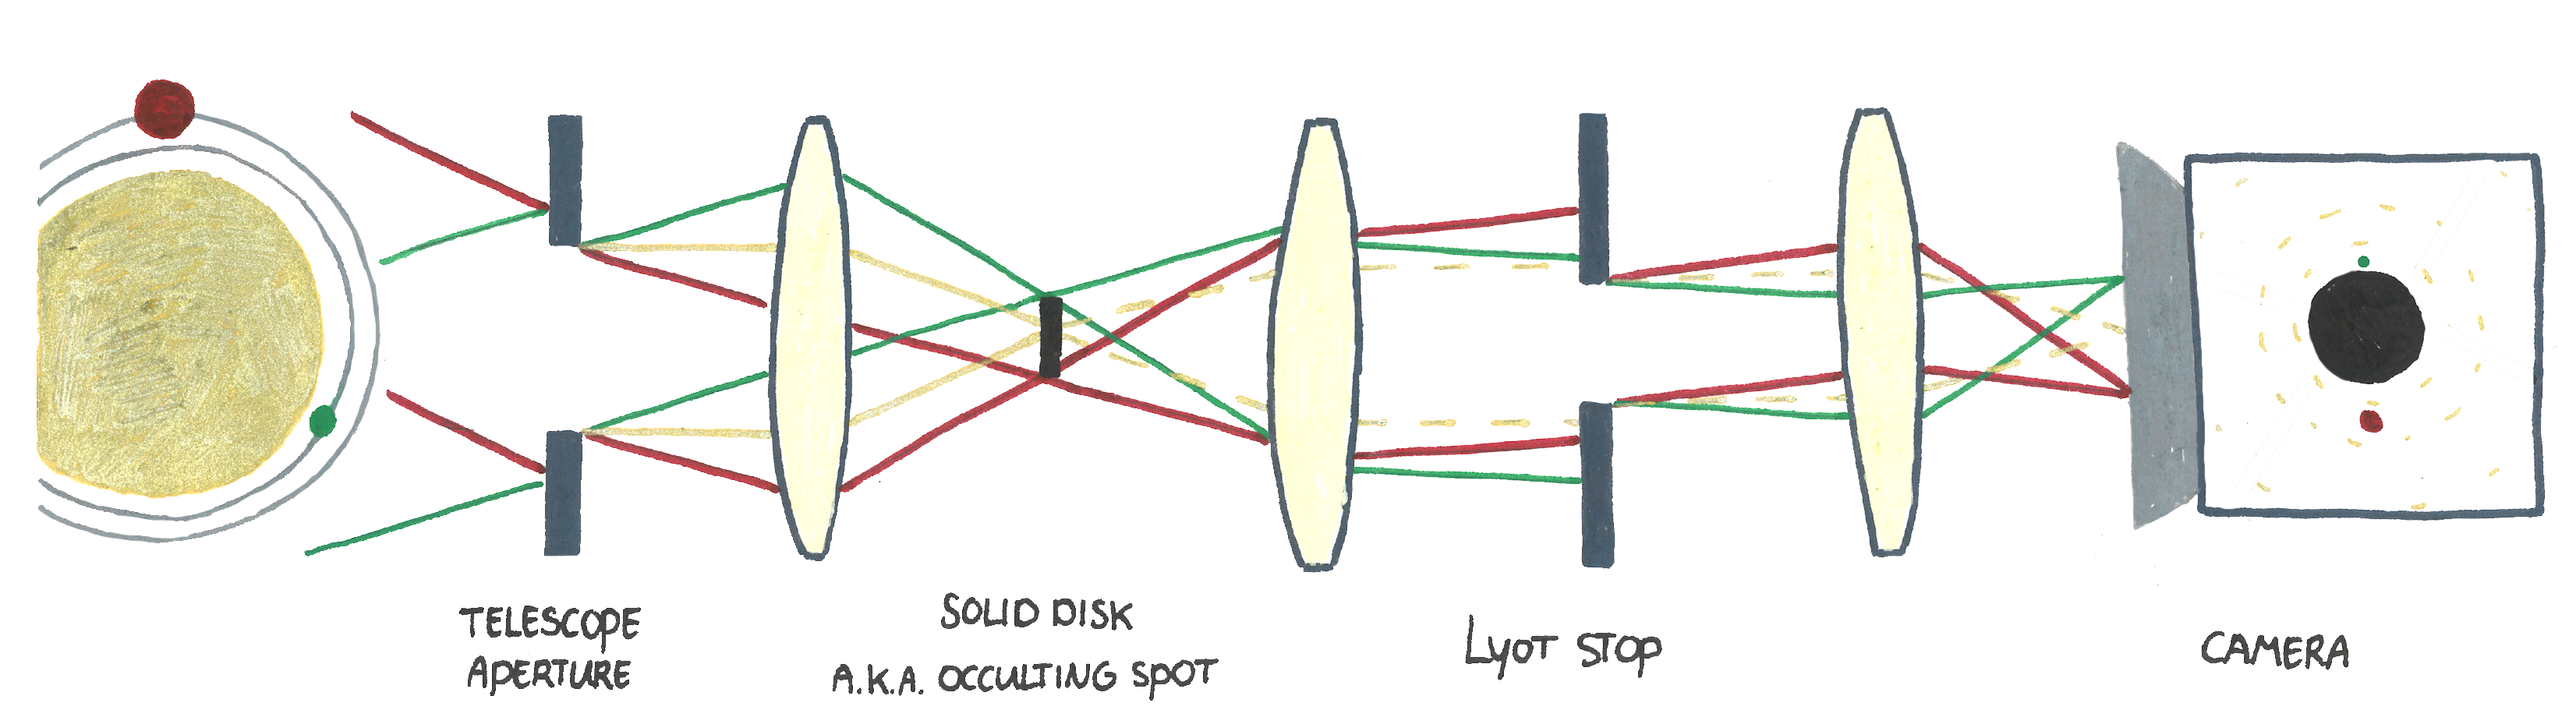
Coronagraphs and their use in HCI • One of the main instruments of Webb, MIRI, offers coronagraphic imaging with four individual coronagraphs. One of the coronagraphs is based on the a so-called Lyot design; a very classical type of a coronagraph. The Lyot coronagraph uses a small metallic disk to block most of the light coming from the central bright star in the first instrumental focal plane. Light from the star is concentrated around the edges of the telescope pupil and forms rings around the edge of the aperture image and the secondary mirror image. Thereafter, a Lyot stop blocks out the remaining rings of light coming from the central star while light coming from objects next to the star passes through to the final image on the camera.2
Did it occur, that the images produced by reflector telescopes do not have holes or shadows in them? A question for you to understand the principle of a coronagraph would be: What is the difference between an occulting spot, part of a Lyot coronagraph, and a secondary mirror that is placed above a primary mirror, blocking a specific area of the sky?
Light rays from the unblocked parts of a primary mirror are all added together when they are focussed together. The focus is not on the blockage, but on the sky, far, far away. If you want to visualize this, you can do the following experiment. Look with both your eyes to an object or wall at a distance of about 5 meters. Straighten of your arms forward and point your pointing finger upwards. If you focus on the wall you notice that you can see the entire wall even though your finger is right in front. When focusing on your finger close by, you will see that you cannot see the background anymore. Could you answer the question? What would be the difference?
1 Up until 2014 this was the most adapted method to find exoplanets. After the launch of the Kepler (Space Observatory), many more planets were found using the Transit method, resulting in the Transit method being the leading exoplanet detection method nowadays.
2Note this is an example of a Lyot Coronagraph. This type of coronagraph cannot reach a high contrast for object very close to a star. However, improvements to this original concept led to many high-performance coronagraph designs.
Posts from December 2021
Rewrite the history of the Cosmos
It takes a planet to explore the Universe.
The process of research is never linear. To keep this line of thought alive, I will also let the current blog take a little bit of a turn. While I expected to tell more about my own research projects in the past month, the launch of the James Webb Space Telescope became slightly too exciting!
After 25 years, the time had come. On Christmas morning, my family was aware of the importance of the James Webb Space Telescope for astronomers and we all sat in front of the television, watching the NASA livestream. Everyone held their breath during the last 10 seconds to 13:20, only to then see Ariane-5 disappear into the clouds in a sigh of relief. Seconds later, the mobile phone is glowing with the messages: "Merry Christmas”. After all, this Christmas, all astronomers received a wonderful Christmas present: a successful launch of the James Webb Space Telescope.
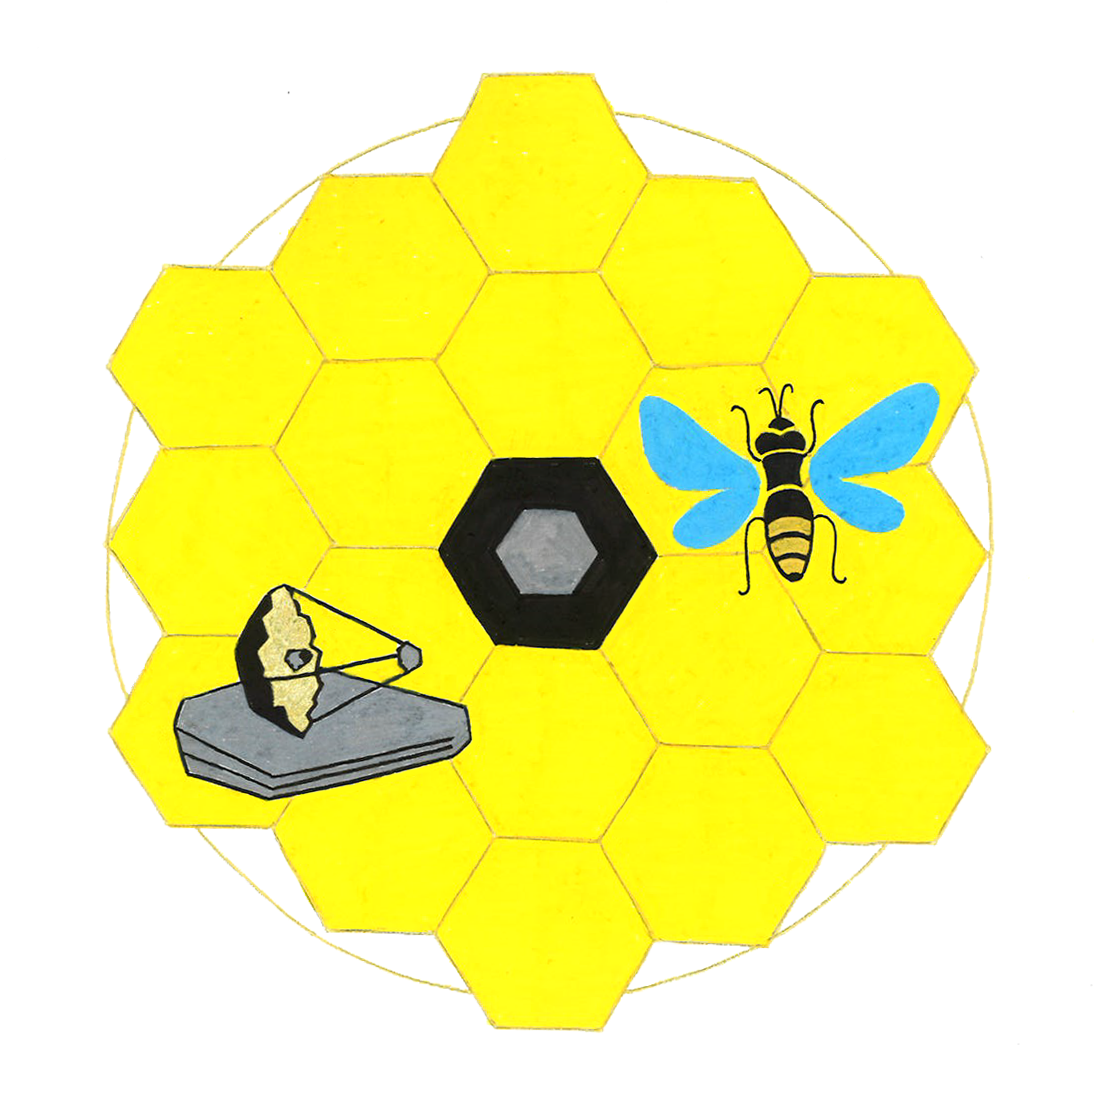
James Webb Space Telescope • Learn more about the Cosmos with the James Webb Space Telescope
The James Webb Space Telescope, which originally was known as the Next Generation Space Telescope, wrote history before it was even launched. Where the original 'simple' design began as a 500 million project taking only 11 years to complete, it has evolved into an astronomically complicated 10 billion project that required thousands of researchers from more than 300 institutes to finish and prepare for launch. What makes the telescope so extraordinary and complex?
- Gigantic: It is the biggest space telescope ever. The entire telescope is as tall as a three-storey flat and as wide as a tennis court. Since the Ariane rocket body is 'only' 4.5 metres wide, the telescope was designed to be folded in origami-style to fit inside the rocket. Once in space, the telescope unfolds.
- Honeycomb: The primary mirror is made up of 18 golden individual hexagonal mirrors, each of which is almost 1.5 metres tall. Obviously, everyone currently knows exactly how tall 1.5 metres is. Combined, the mirrors form one single large mirror that is no less than 6.5 metres tall and wide.
- Smooth: The surface of the individual mirrors should be so smooth that, if the entire surface of the mirror were as large as Europe, there should not be any hills or valleys higher than an ankle's height.
- Solar protection: A solar shield is meant to protect the telescope from infrared radiation coming from the Sun, the Earth and the Moon. In this way, the shield forms a barrier between the solar and shadow sides, which have a temperature of about 110 °C and about -230 °C respectively. It is like using sunscreen, only then with a sun factor of 1 million. In order to form this barrier, the sunshield consists of 5 separate layers. Each layer is made of Kapton and is as thin as a single human hair.
- Powerfull: Webb is 100 times as powerful as the Hubble Space Telescope. Webb can capture light from objects created 100 million years after the Big Bang. These new discoveries will reveal what the primordial stars looked like 13.7 billion years ago. Until now, the record for observing the oldest and most distant object has been set by Hubble. This object was located at a distance of no less than 13.4 billion years.
- Unreachable: After the first observations made with Hubble, it appeared that the first mirror of the telescope had an optical aberration problem. Hubble orbits the Earth at a distance of about 570 kilometres. This made it possible for astronauts to repair Hubble while it was in orbit. For Webb this will not be a possibility. Webb will be heading towards the Sun-Earth L2 point which is 1.5 million kilometres from Earth and in line with the Sun. This is almost 4 times the distance between the Earth and the Moon. While it takes Webb only 3 days to travel the distance to the Moon's orbit, it will take Webb 30 days to reach the L2 point. Consequently, the telescope cannot be reached when optical aberrations occur. At least, not with today's technology.
For many astronomers, the observations of the James Webb Space Telescope promise to be very valuable. Personally, I am mainly interested in the search for the building blocks of life elsewhere in the Universe. Webb will give us more insight into the constituents of the atmospheres of extraterrestrial planets orbiting stars other than our Sun. In these atmospheres we look for example for water, oxygen, ozone, methane, phosphine, and in particular certain combinations of these atmospheric gases. With particular mixtures of these gases, we are trying to find life as we know it on Earth today.
Posts from November 2021
Eureka!
Simplicity lies concealed in this chaos, and it is only for us to discover it.
During the past month, I disappeared once more into the optical laboratory of the
University of Leiden. This is where, next to Treepol1 and a cosy plastic Christmas
tree, you will find the instrument I am currently working on. This instrument is
called the Life Signature Detection Polarimeter, also known as LSDpol. It is a
spectropolarimeter which measures the polarisation of light over a spectrum (i.e.
the polarisation of the specific colours of the incident light).
The special feature of LSDPol is that it will be the first spectropolarimeter to
measure at one moment what percentage of the incoming light is linear and
circularly polarised, without any moving part. This is quite important if we want
to design an instrument that could potentially be launched into and used in space.
However, the principle involves many things. Given that I have not told so much
about the instrumentation side of my research up to now, I think it would be nice
to change this in the coming posts.
Before I can explain more about the design of and the measurements done with LSDPol,
I have to start off with a little theoretical explanation concerning light. Therefore,
today I will introduce you to an important physical effect that is important to take into
account when designing and building many optical instruments.
Fresnel diffraction • The propagation of lightwaves behind an aperture
In 1801, Young's two-slit experiment showed that light sometimes behaves like a wave, which was completely contrary to Newton's particle theory. To this day, the two-slit experiment is a classic hands-on experiment for physics students, including myself. In the experiment you shine a light source through a single slit. The light from the light source must be spatially coherent. With coherent light one can think of:
- laser light: light that consists of one wavelength, i.e. has "one colour", or
- sunlight: light that consists of several wavelengths in which the so-called phase of the light for all the different wavelengths is similar.
Based on a theory developed by Christiaan Huygens, Augustin Fresnel proposed a mathematical model that could describe the diffraction of light rays. In 1808, Fresnel was one of the participants in a scientific competition that sought to find a mathematical description for a diffraction phenomena. The phenomena was observed in the shadow of a circular screen when it is placed in a beam of light. One of the judges, Siméon Poisson, predicted that, according to Fresnel's theory, at the centre of the circular shadow a bright spot would appear with the same luminosity as the light rays hitting the screen. Shortly afterwards, François Arago, one of the other judges, carried out this experiment which showed that a bright spot appeared on the screen. This confirmed Fresnel's theory. This bright dot is now called the Poisson, Arago or Fresnel spot.
Well, why am I telling this story about Fresnel and Fresnel's theory? Apart from the fact that I admire Fresnel for the theoretical and experimental study of the behaviour of light (basically what I also do with my instruments), I recently found out that in order to understand my instrument, I also need to learn much more about the Fresnel theory. The reason why this theory is so important will be explained in the coming posts. Stay tuned!
1 TreePol is one of the instruments that I use in my search for signs of life on Earth. The design of TreePol is made with the aim to measure the percentage of a light beam that is circularly polarised as accurately as possible. The molecules in vegetation produce this circular polarisation signal when sunlight reflects off the surface of the leafs.
Passing on knowledge is a true art
If you can't explain something simply, you don't understand it well enough. A. Einstein.
Ready, stage, go! The past few weeks I was very happy to be able to give four
separate talks on my big hobby astronomy and on "life in the Universe ". Full of
enthusiasm (and also a bit stage fright), I stood in front of four different
groups and told them about my research. Two of them took place in a classroom,
one on a pop stage and the last one even in a pub! But what does all of this have
to do with Albert Einstein's quote in the title of this blog?
The quote describes very well what my approach is when I want to explain something,
how I prepare for different talks and how I decide on what exactly I am going to
talk about. I am always sure to be able to answer the following questions: "What
am I excited about at the moment?", "How long do I have to talk about this
subject?", "What does my audience know about this subject?", but mainly: "What
will be my take-home message?".
"Everything should be made as simple as possible, but not simpler" said
A. Einstein.1 Sometimes I am listening to a presentation and all the
information goes into one ear and out the other one. At the end of the talk, I
then ask a question and get an answer that is even more confusing than the
presentation. For me personally, the art of transferring information is always to
make things as simple as possible without losing or affecting their essence. At
the end of my talk, I want to have passed on some of my knowledge to the audience.
As a scientist, I dare to say that a great fear of some scientists is that when a
difficult theory is simplified too much, whatever you are telling is no longer
exactly accurate. There is also the fear that you will come across as 'less clever'
than you actually are, because everything you say is 'simple'. For example, after
a presentation, a student came up to me and told me that he/she would never study
astronomy because it was too easy for him/her. This taught me that it is very
important to have the perfect balance where the audience understands your
presentation however, the presentation is not too simple. This concept is crucial.
In the last two weeks, while preparing my talks, I came across a splendid theory,
which made me think about Einstein's quote again. This theory is also known as the
"Iceberg Theory".
 The power of elimination - Iceberg Theory •
The density of ice is about 10% smaller than the density of water. This is why
icebergs (partly) float on the water. The largest part of the iceberg lies below
the water. Therefore, we only see a small part of the ice. The American writer
Ernest Hemingway described his writing with this principle of an iceberg.
The power of elimination - Iceberg Theory •
The density of ice is about 10% smaller than the density of water. This is why
icebergs (partly) float on the water. The largest part of the iceberg lies below
the water. Therefore, we only see a small part of the ice. The American writer
Ernest Hemingway described his writing with this principle of an iceberg.
Ernest says that although as a reader you can only see the tip of the iceberg,
you also know that there is still a lot of ice (knowledge) supporting the tip.
He mentions that when a writer lowers the tip of the iceberg into the water a
tiny bit deeper, the iceberg gets an even firmer support. Only when a writer
leaves out some information because he doesn't have the knowledge, there is a
gap in the foundation which doesn't help the story.
I dare to compare my way of presenting with this iceberg theory. When I give a
presentation to an audience, I also only show the tip of the iceberg. For me it is
important that when I talk about a subject I can also expose the ice beneath the
water (the knowledge) when I get questions on the topic. So in other words, I have
my own variation on Ernest's iceberg theory.
Important lesson 5:
Before making a presentation, think about how big "the iceberg" is that you want
to present. Only when you have a clear picture of the whole iceberg can you start
thinking about what the tip of the iceberg is going to be like.
1 This quote by Albert Einstein has been discussed several times.
Scientists are not sure whether he said it exactly in this way. It is believed
that it was an interpreted summary of one of the statements in his 1933 lecture.
There he mentioned that "it can hardly be denied that the highest aim of all
theory is to make the irreducible basic elements as simple and as few as possible
without having to give up the adequate representation of a single fact of
experience". Quite a mouthful, isn't it!

Posts from October 2021
Corona virus vs. Ice Crystals
You can not escape from the aerosols
The COVID-19 aerosols are slowly disappearing from the air and with
that social activities are starting to pick up again. Especially now, it is
important for me to maintain the wonderful habits we picked up during the
quarantine. So, it's time for a brand new (science) blog!
Since posting the June blog, I have certainly not been inactive. In July, I managed
to write a proceedings paper for an instrumentation conference that was held in
San Diego, California. This SPIE conference, Society of Photographic Instrumentation
Engineers, focused on polarisation instruments and remote sensing. I will tell you
more about this topic later!
At the moment, as the drawing of this blog illustrates, I have started an
investigation into (the scattering of light by) ice crystals. But why ice, and
how does this connect to my search for "biosignatures” and my models of an
Earth-like exoplanet outside our solar system?
Well... Not only is looking at beautiful ice crystals a wonderful occupation, but
apart from the fact that you can stare endlessly at the infinite different possible
shapes and structures, they are very important in, for instance, climate studies.
The effects of the presence of ices in the atmosphere are still very unclear though
could potentially cause major changes in the temperature of a planet, including
our Earth. I do think that the climate is very important, but what I am looking
for is how light is scattered by ice crystals. The scattering properties of ice
strongly depend on the shape and size of the individual crystals. For example,
many small crystals will reflect more sunlight than less large ones. In many
models, researchers assume that the ice crystals look like a hexagon. This shape
makes it easier to calculate how light is scattered, but we can actually say that
the assumption is not entirely correct. In fact, if all the ice crystals in the
atmosphere had a hexagonal shape, we would witness many more halos.
Important lesson 4:
Do not try to google "ice halo" (ijs halo) in Dutch. You will only find pictures
of (very tasty) ice cream in cups.
Ice halos are beautiful optical effects that are created by the refraction of
sunlight. There are various types of halos that can be created. The most commonly
known ice halo is the 22° halo. It gets its name from the fact that the radius
of the circle is 22° with the light source located in the centre of the
circle.
Okay, I am deviating from the subject, because why are ice crystals so important
for my research? Our Earth's atmosphere contains many thin ice clouds that scatter
sunlight in a different way than the spherical (liquid) water clouds. If I want
to investigate whether I can measure the signals of life on Earth through the
clouds, I also need to understand the effects of ice clouds above the Earth's
surface. That is what I am working on at the moment. So, in the coming months
there will be updates about my new passion: ice crystals.

Posts from June 2021
Do you know liquid crystals? Well, you look probably look at them right now!
Liquid crystals in your television, as well as in my optical instruments
The first time I heard the term: 'liquid crystal', I thought of a kind of pan
on a very high heat in which crystals were melted. A liquid is a liquid, right? Well,
technically not entirely. Molecules in liquid crystals are capable of flowing, but at
the same time they are also ordered and oriented with respect to each other. This means
that if we look at the crystal face forwards, it has different properties than if we look
at it from the sides. We can modify the ordered direction of the molecules by passing an
electric current through the crystal or by exposing it to light or heat. This enables us
to change the optical properties of the crystal. One important property, for example, is
the refractive index1, which depends on the polarisation properties of the crystal.
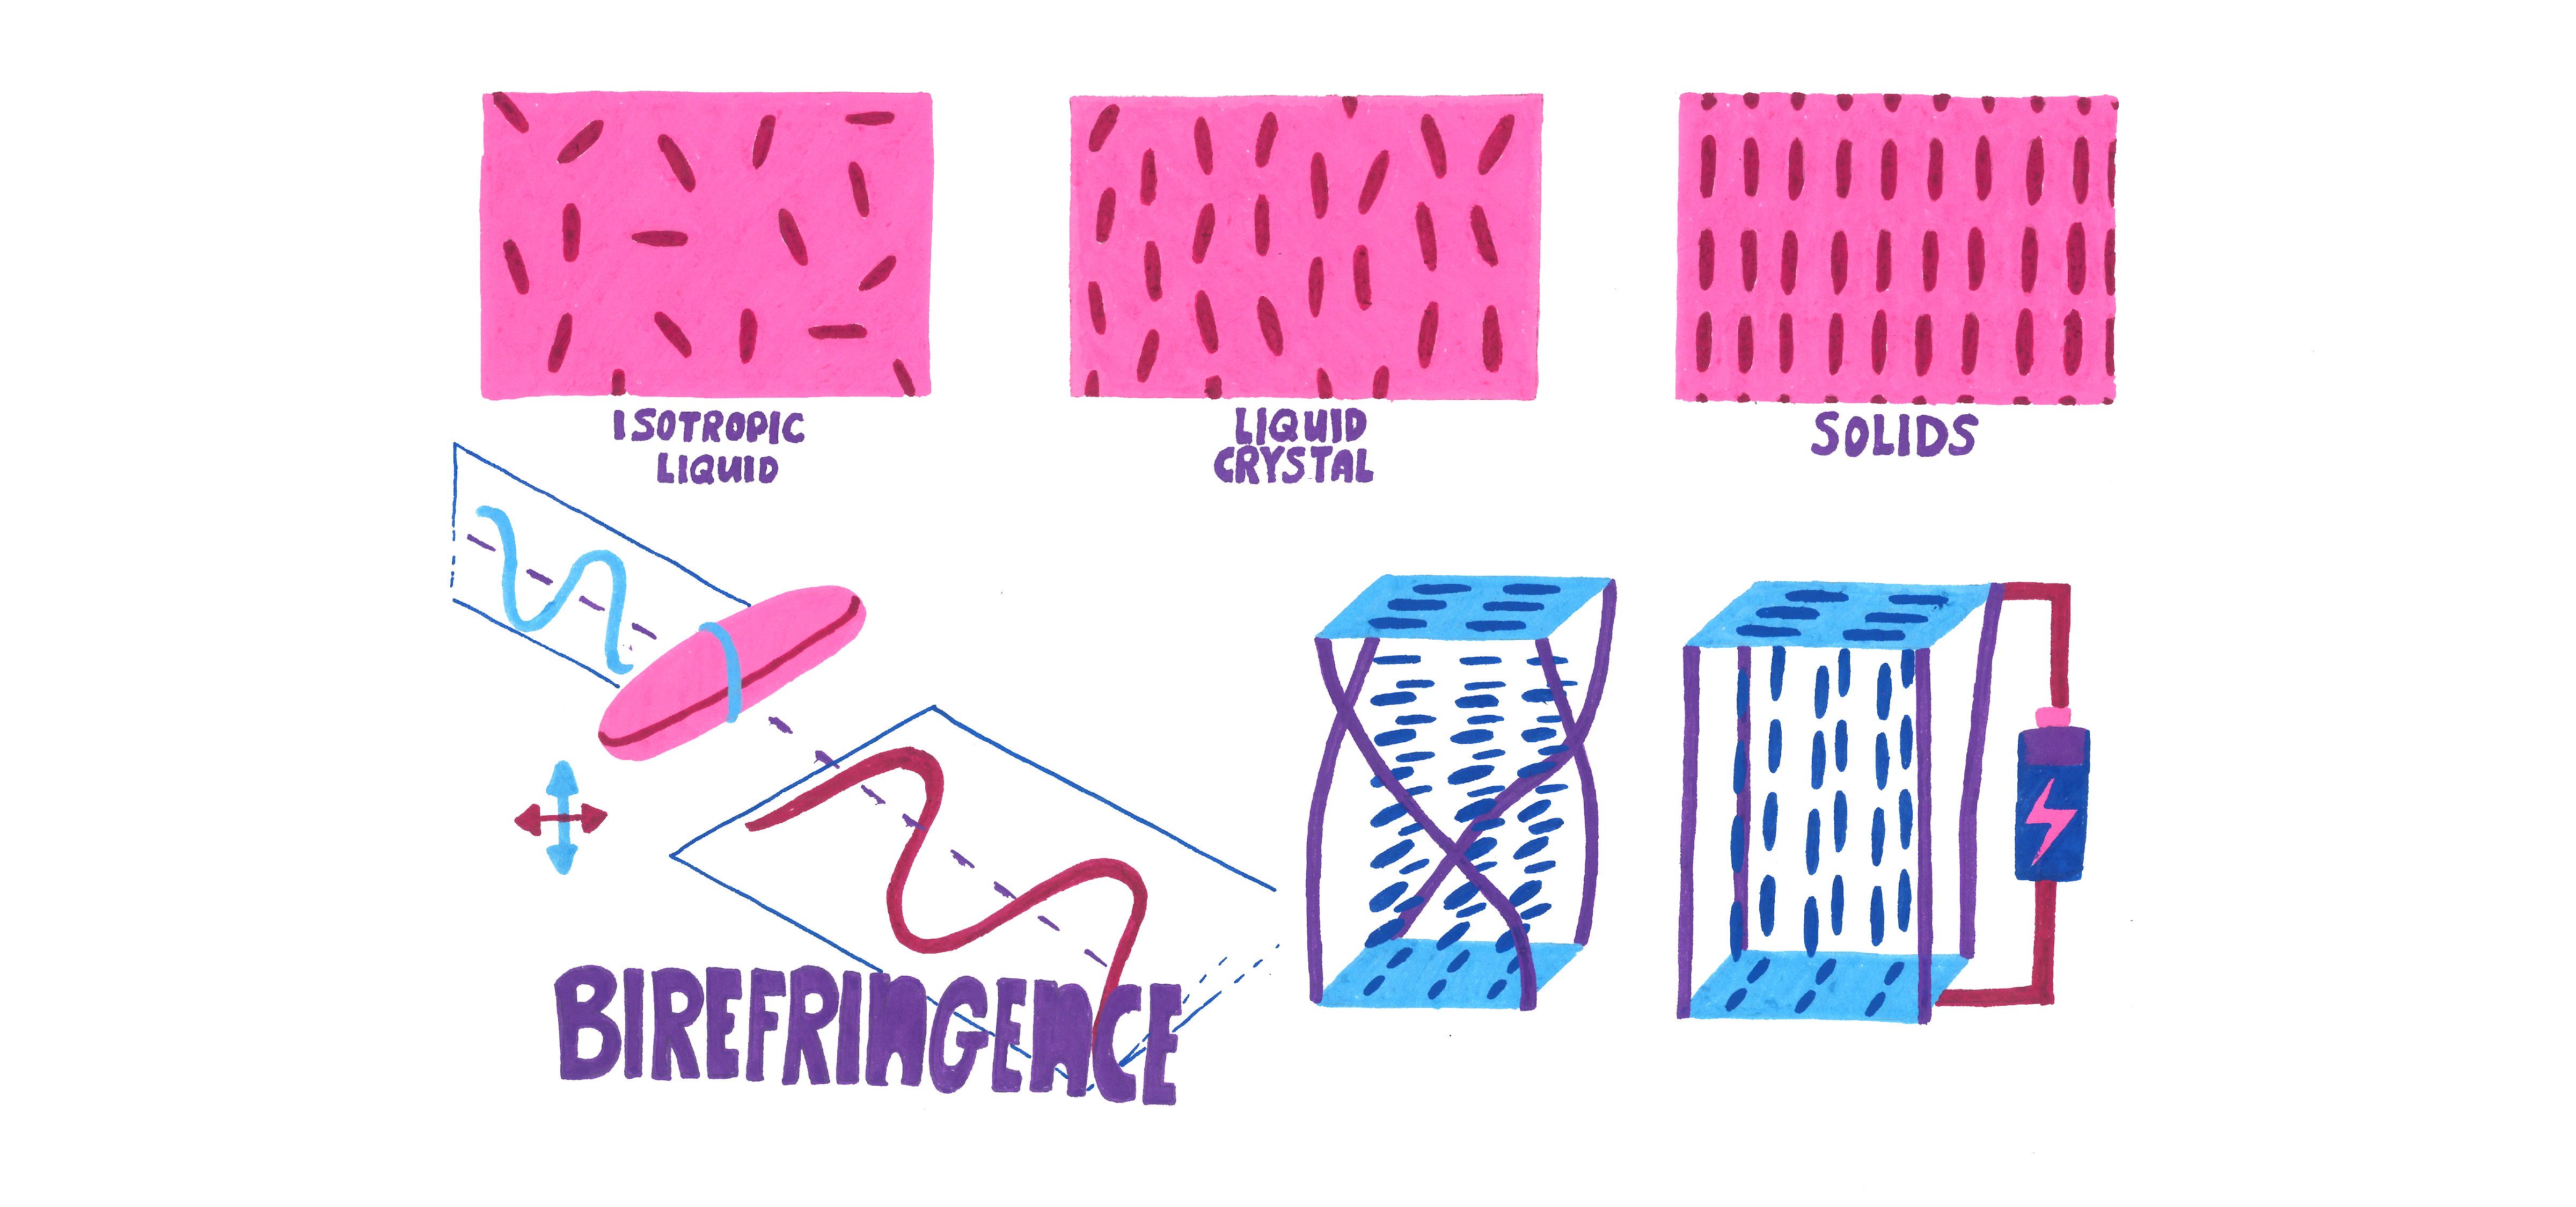 Birefringence • Some materials influence light by an optical property that we call birefringence.
Birefringence, also referred to as double refraction, is a property in which the
refractive index of a transparent material depends on its polarisation direction.
A non-polarised light beam incident on the material is split into two polarised
light beams that have their polarization directions perpendicular to each other. For
instance, horizontal and vertical. Christiaan Huygens, a famous Dutch astronomer from
the 17th century, described this phenomenon while exploring the double refraction of
light in a crystal called calcite.
Birefringence • Some materials influence light by an optical property that we call birefringence.
Birefringence, also referred to as double refraction, is a property in which the
refractive index of a transparent material depends on its polarisation direction.
A non-polarised light beam incident on the material is split into two polarised
light beams that have their polarization directions perpendicular to each other. For
instance, horizontal and vertical. Christiaan Huygens, a famous Dutch astronomer from
the 17th century, described this phenomenon while exploring the double refraction of
light in a crystal called calcite.
Why am I telling you about liquid crystals and this birefringent property? Well, a
nice fact is that you look at these liquid crystals (almost) every day! The abbreviation
LCD stands for liquid crystal display. The crystals in the pixels of the screen make
sure that we can easily switch the pixels off and on with a tiny electrical current.
In addition, I work with liquid crystals as part of my research. Not only do I spend a
lot of time behind a computer screen, but they are also incorporated into components of
the instruments that I use to do my research: Treepol and LSDpol. In their liquid crystal
components, we can use birefringence to change incoming polarisation signals. For example,
we can transform linear polarised light to elliptical polarised light. Soon I will tell
more about how we can also use these crystals without using electricity. This is essential
for optical instruments that we want to send into space.
1 The refractive index of a material indicates how much light is deflected
when it travels through the interface of two different materials. The index of refraction
depends on the wavelength (also called 'colour') of the incoming light. This wavelength
dependency helps us to understand why we can use a prism to split white sunlight into different colours.

Posts from May 2021
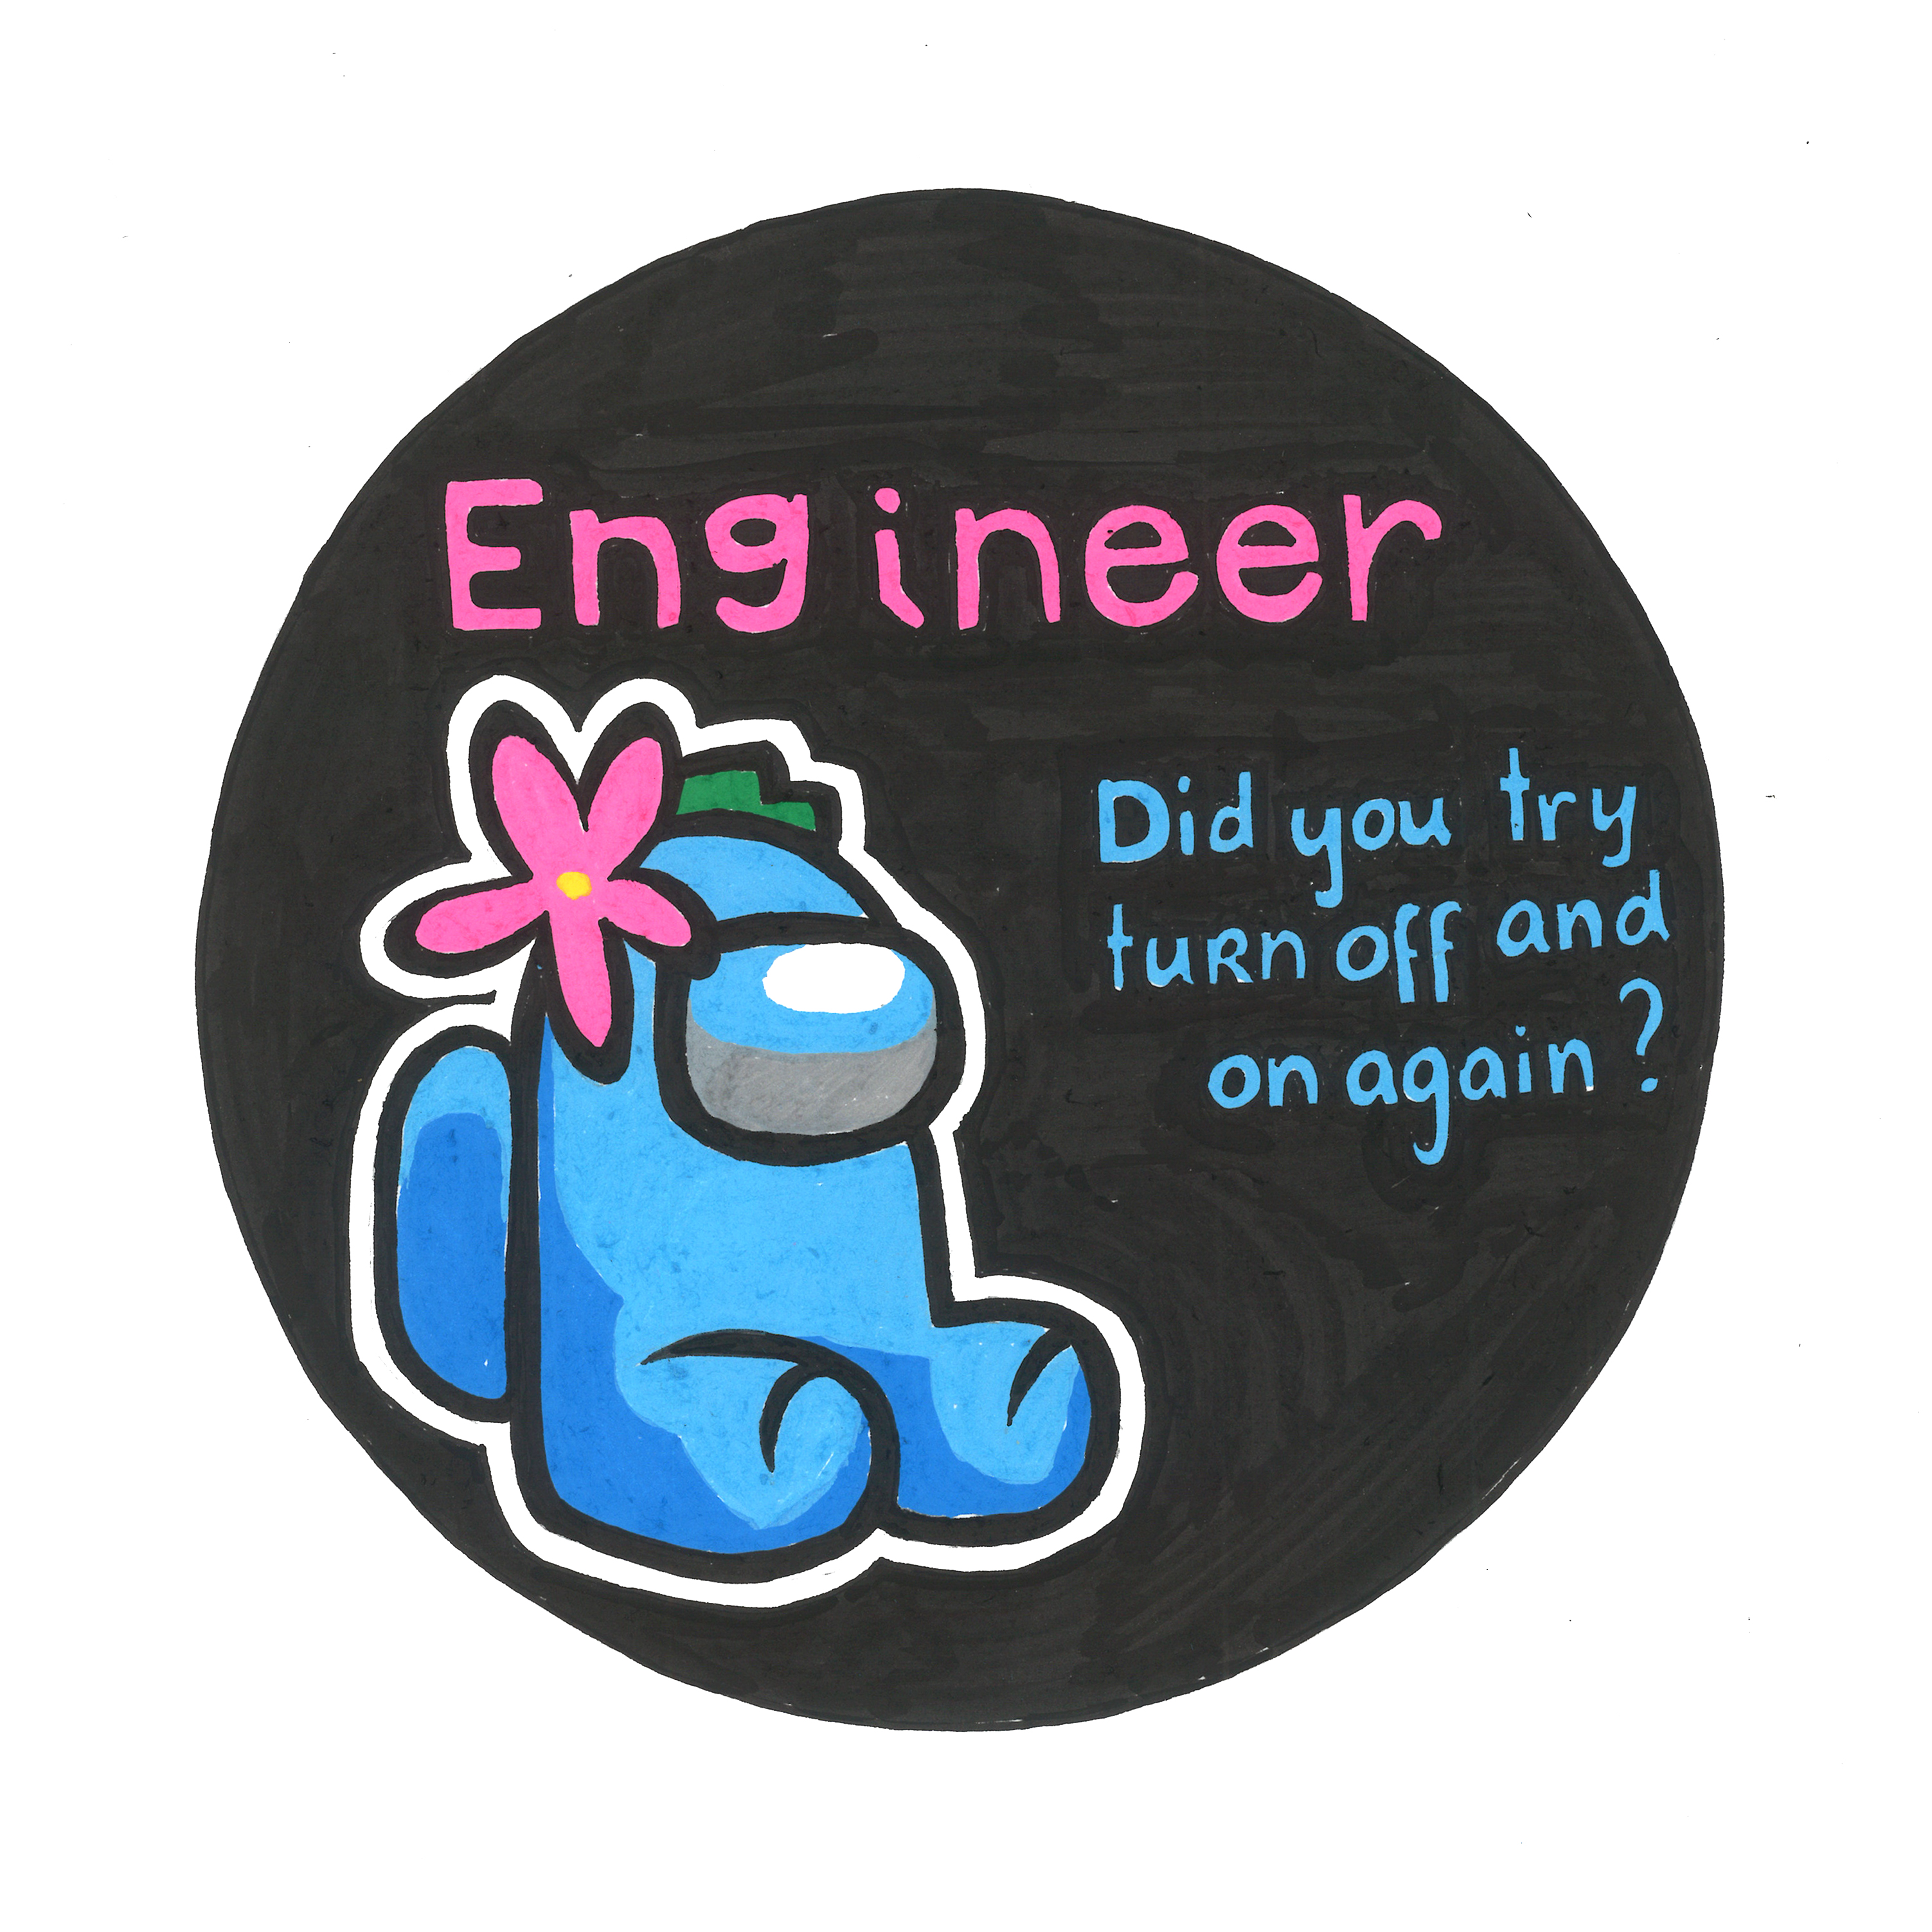
Did you try to turn it off and on again?
Do not panic! Trust me, I am an engineer, or... am I?
Last week, I spent quite some time working in the lab again. In the near future,
I would love to do some outdoor measurements, to start searching for life. However,
there are still a few technical issues that are holding me back from going outside.
One of the instruments I work with is called TreePol and measures the circular polarisation
of light. This state of polarisation is generated, among other things, as a result of
the homochiral property of chlorophyll (in green leaves).The instrument is a spectropolarimeter.
It measures polarisation over a spectrum, just as the word spectropolarimeter implies.
Looking at the polarisation signal over a wider wavelength range is important. Chlorophyll
molecules found in leaves react most strongly to light when it has a wavelength in
the red region of 680 nm. This causes part of the sunlight hitting the molecules is
circularly polarised. This circular signal is very small (~ 1/10 of a percent!) but
big enough to tell whether a leaf is alive or dying.
But how can TreePol measure this (circular) polarisation state of lightwaves? In optics,
we have optical elements that slow down the electrical direction of light, so-called
retarders. With these, we can turn circular polarisation into linear, and vice
versa. You can find more information below!
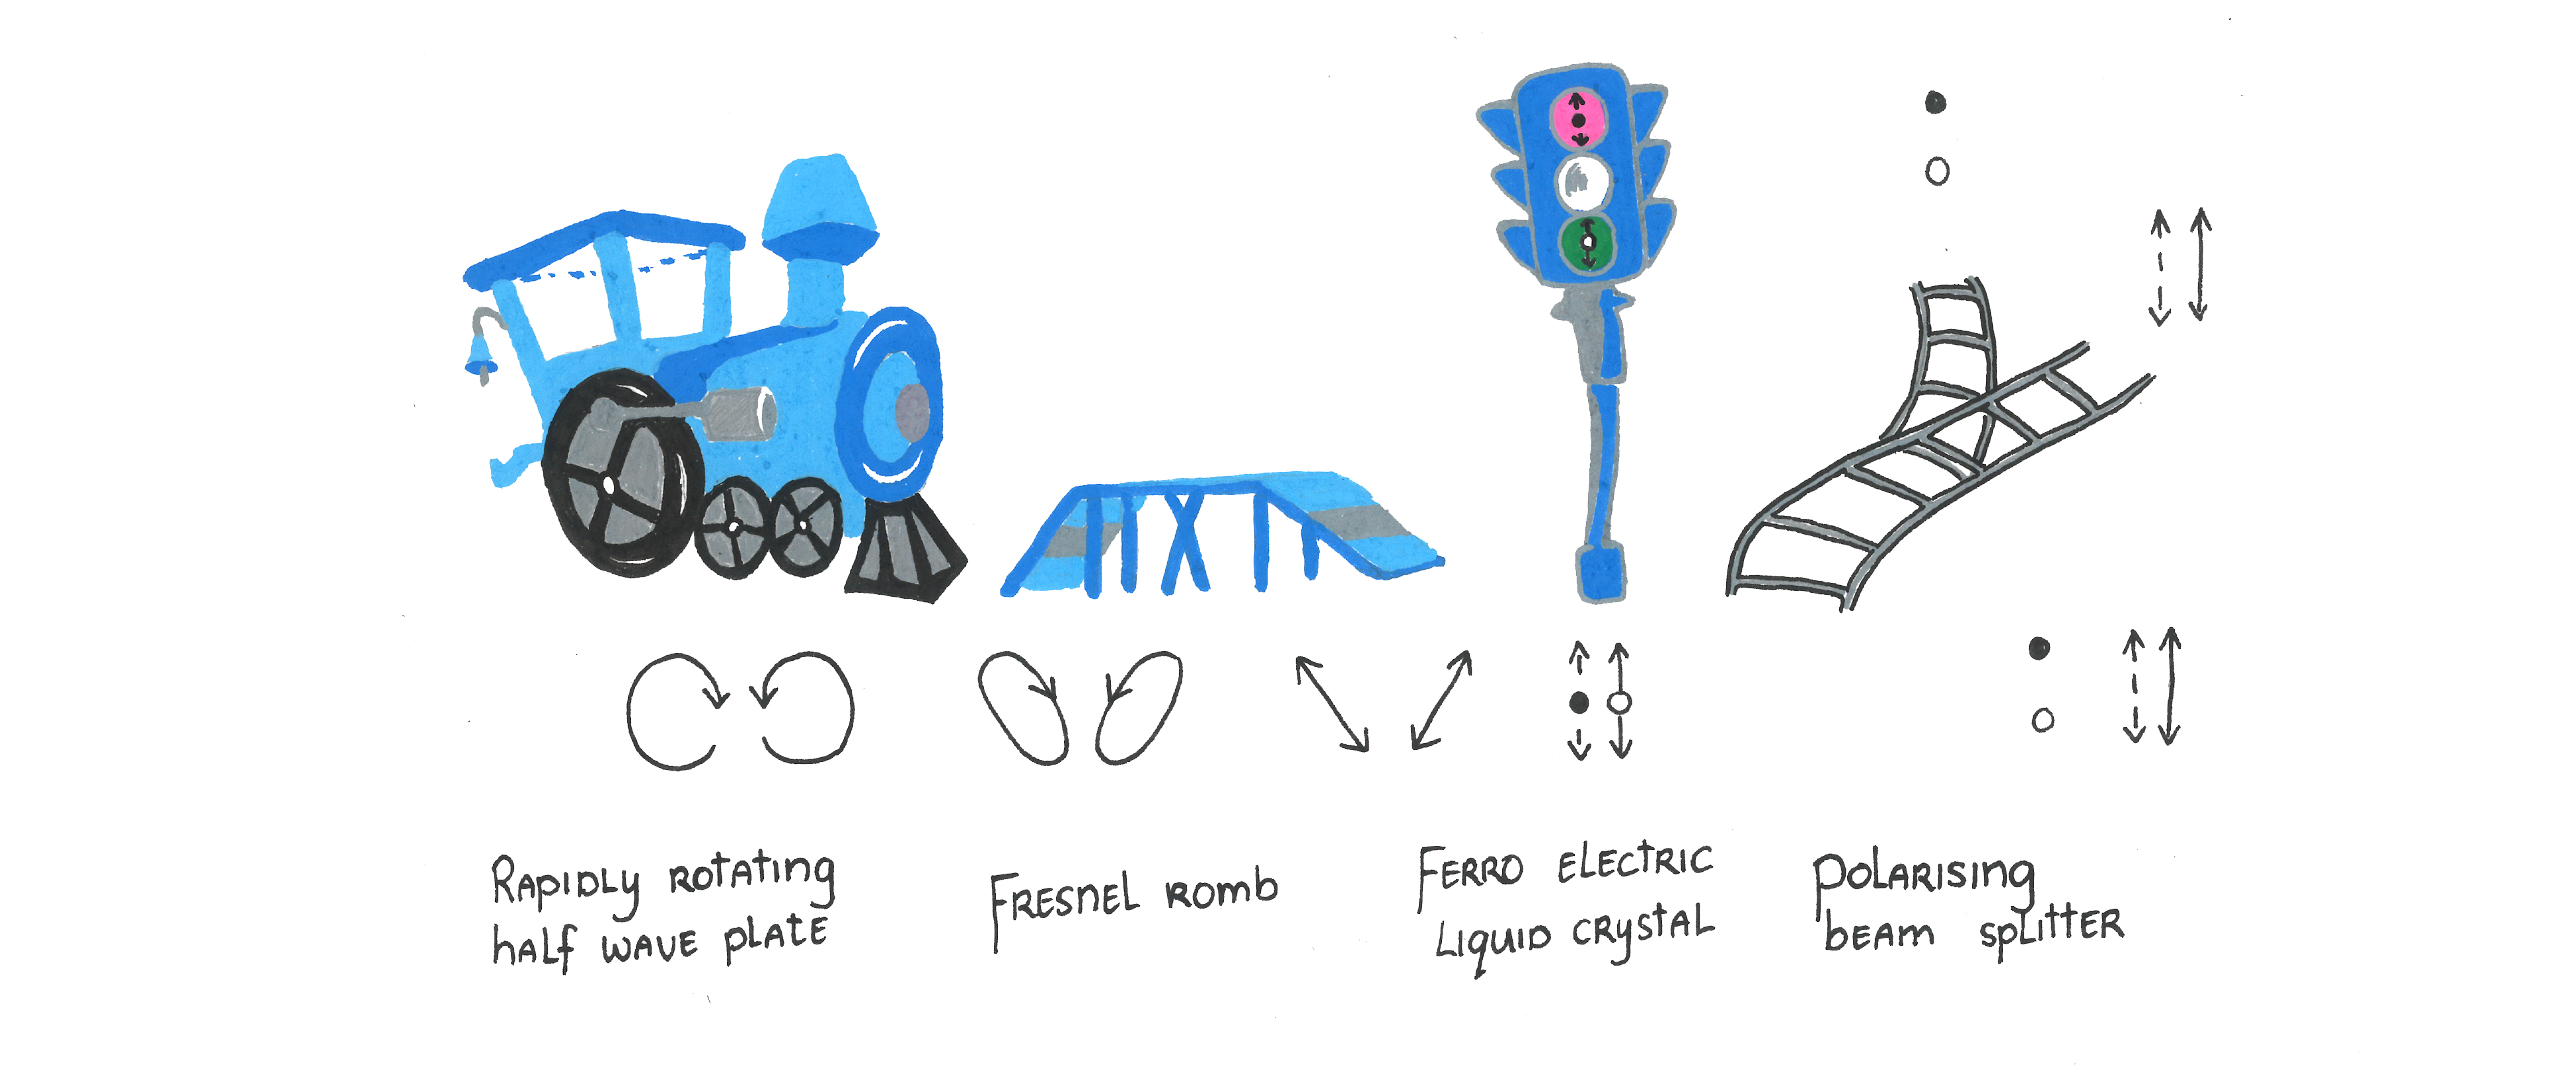 The principle of Treepol • measuring by modulating
By shining non-polarised light through (transmission) or on (reflection) an ivy leaf,
we activate this characteristic feature of chlorophyll. We aim TreePol at the leaf and
the scattered light falls on the instrument.
- At the front there is a half-wave plate that we rotate very fast with a very fast motor. Only circular polarised light can travel through this, bringing this signal into our instrument at high-speed (like a train).
- Thereafter the light passes through a Fresnel romb. This is also a retarder that delays the light twice, like a kind of bridge, by one-eighth of a wavelength. In total it delays the wave by a quarter of a wavelength, changing the circular signal into a linear one.
- A ferroelectric liquid crystal functions as a kind of traffic light that we can control with electricity. When it is red, it changes the incoming signal in exactly the opposite way to when the traffic light is green. As a result either a vertically or horizontally linearly polarised signal comes out.
- Finally, we have a polarising beam splitter which, like a train switch, sends the vertical and horizontal in two different directions.
According to the Cambridge Dictionary, the definition of an engineer is a person whose work consists of repairing or controlling machines, motors or electrical equipment. The verb engineer means to design and build something according to scientific principles. On the Internet I also found some terms that are applicable to me. For example, I am a person who is very good at solving problems that I didn't know I had.
1 See my blog post on March 21 to find more information regarding homochirality.
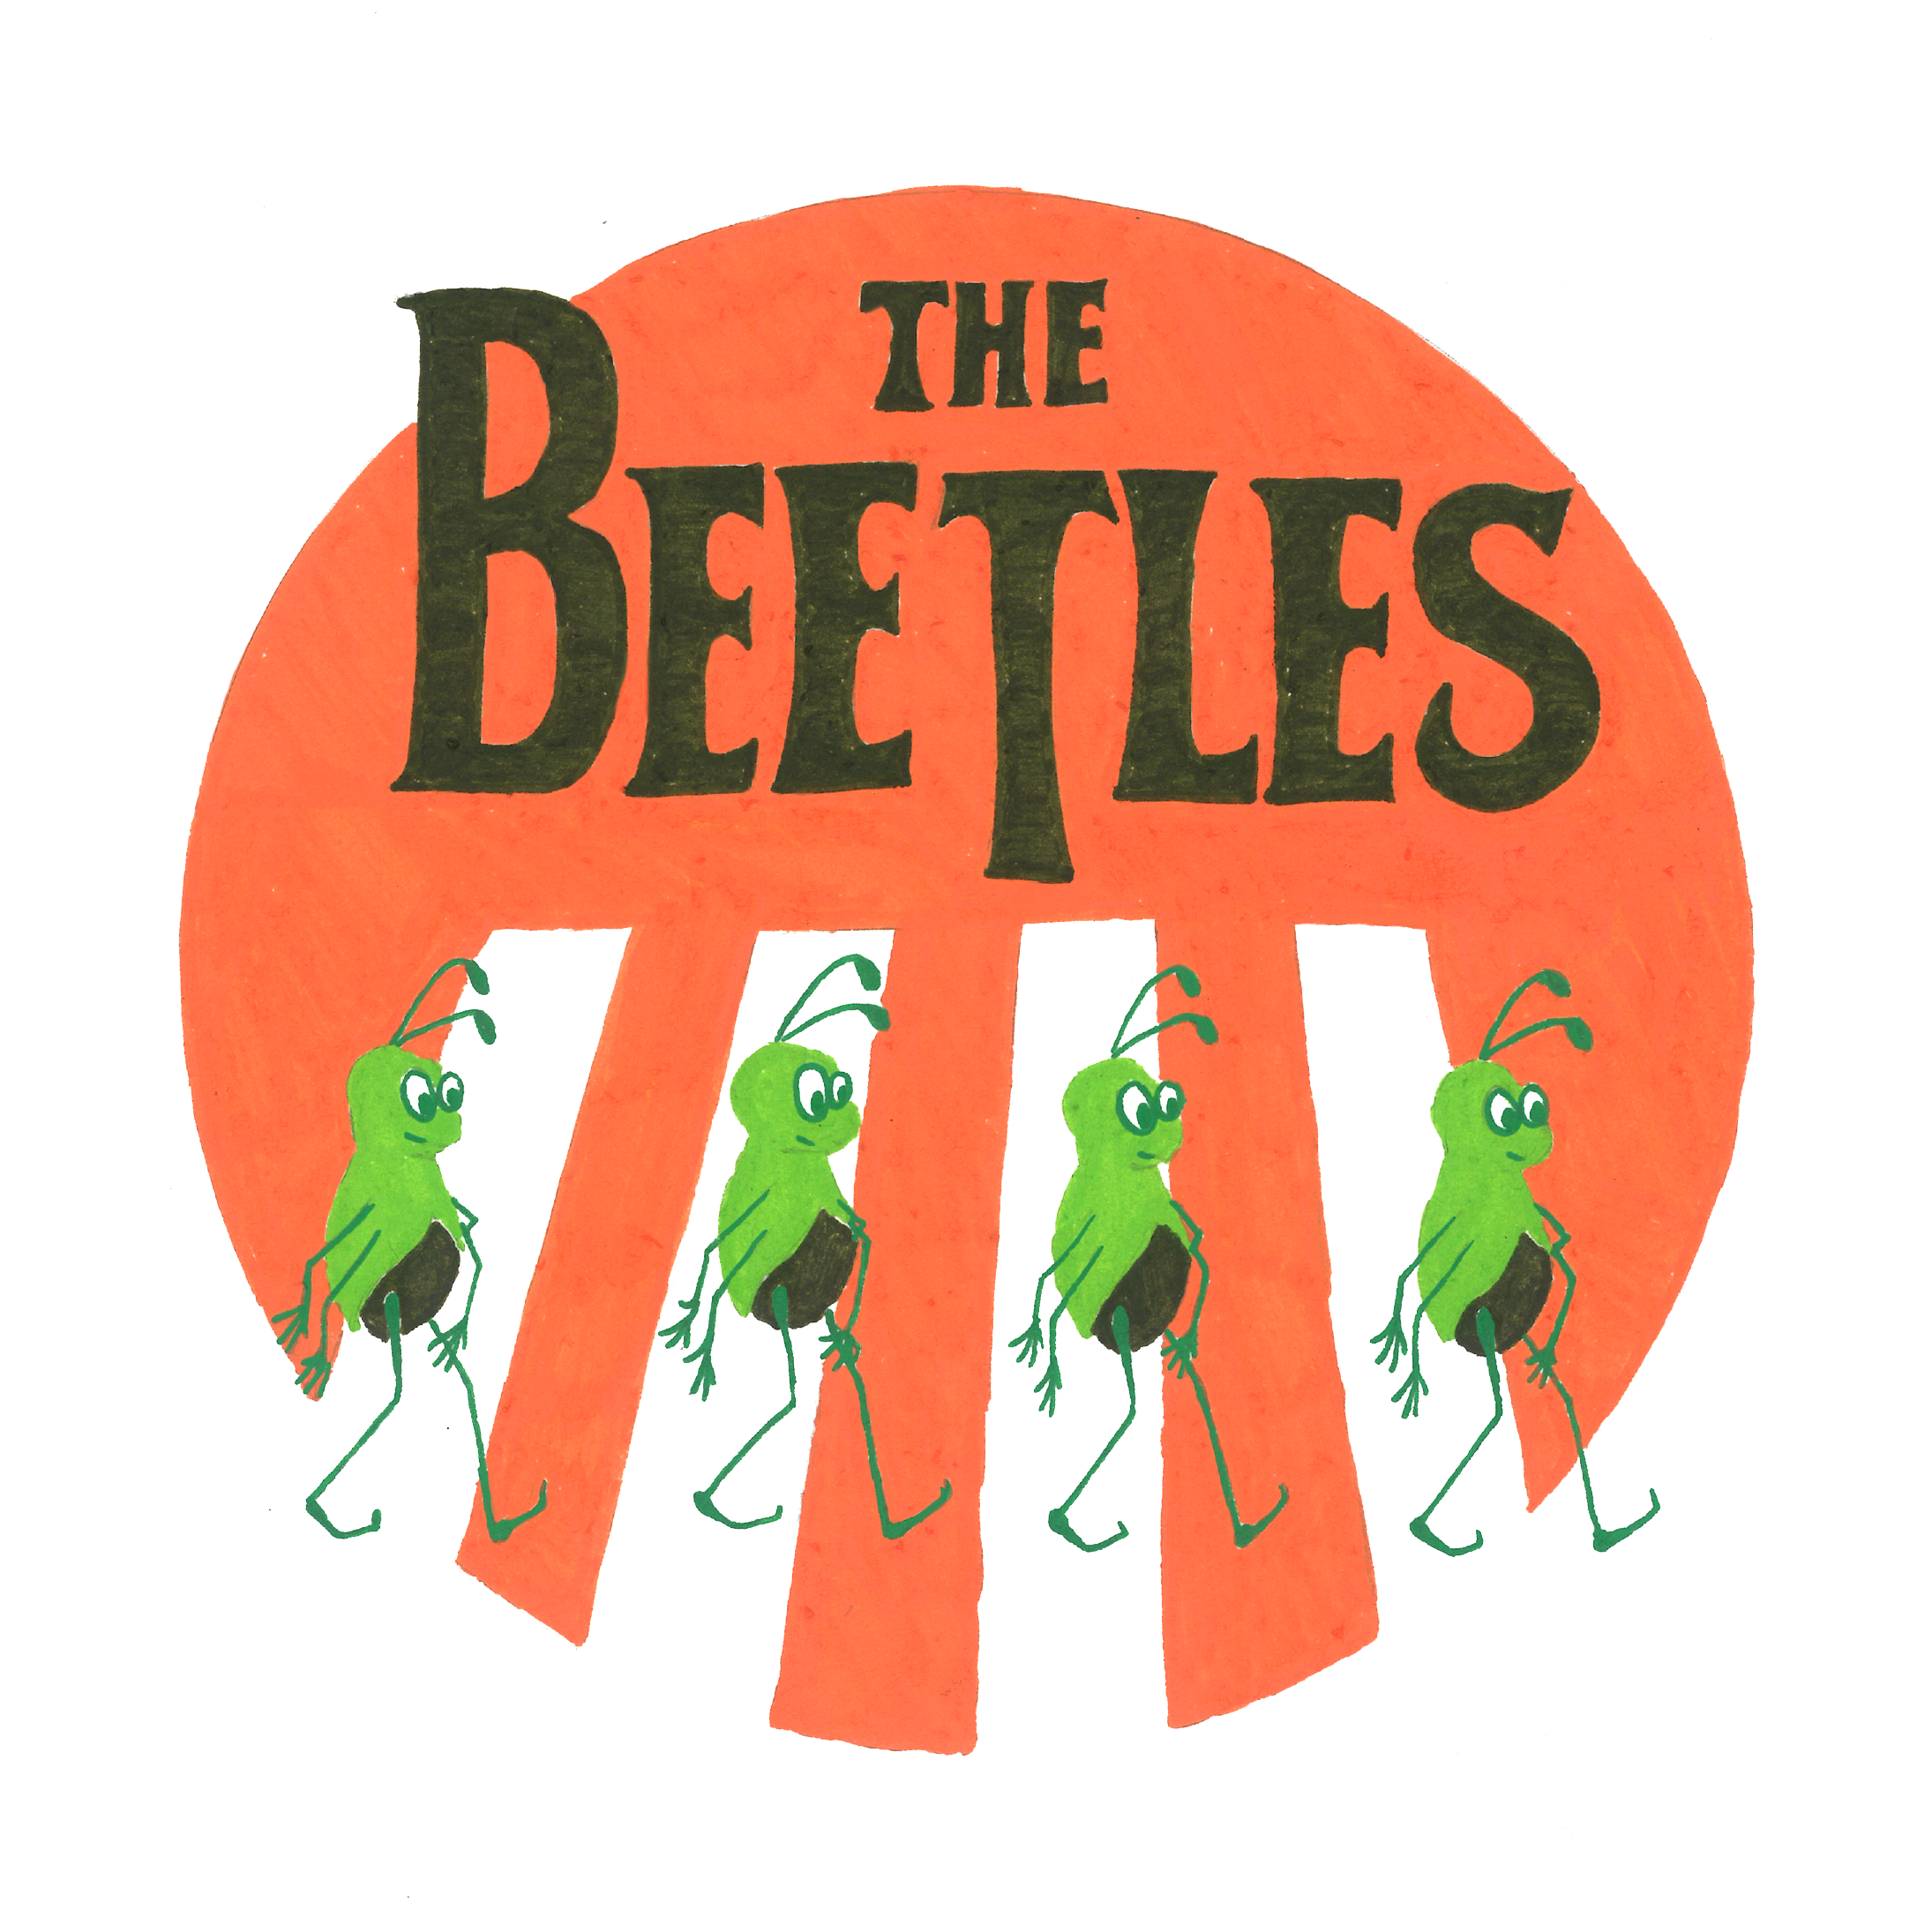
The Beetles
"When the night is cloudy there is still a light that they will see"
Yes, I know that this sentence is not to be found in "Let it be", but wow,
it really fits my thoughts perfectly. Last week, I had the pleasure of giving two
presentations to tell an audience and colleagues about my research. And I confess:
while preparing these talks, I always get super excited again about my research!
For example, take the case of the theory of homochirality: the left- or right-handedness
of molecules that is characteristic of life. In my blog of 21 March, I explain that
we are looking for unambiguous signs of life, of which the concept of homochirality
is central to my research.
During my talks, I explained the principle of homochirality with a shiny green beetle.
Green beetles are 100% homochiral. When sunlight shines on their skin, the reflected
light is 100% left circularly polarised. This causes us to see a green beetle with one
eye and a pitch black beetle with the other, when we look at the beetle through 3D
glasses! Isn't that cool!
Besides this phenomenon, non-green beetles can also be linked to astronomy. African
dung beetles study the sky at night. They navigate themselves with the Moon and, when
the sky is cloudy, with the polarisation direction of the Moonlight. Moonlight is
reflected sunlight, so during daytime they do the same thing but then with sunlight!
In this way, they always know how to find their direction of travel at all times.
"When the night is cloudy there is still a light that they will see", the Beetles.
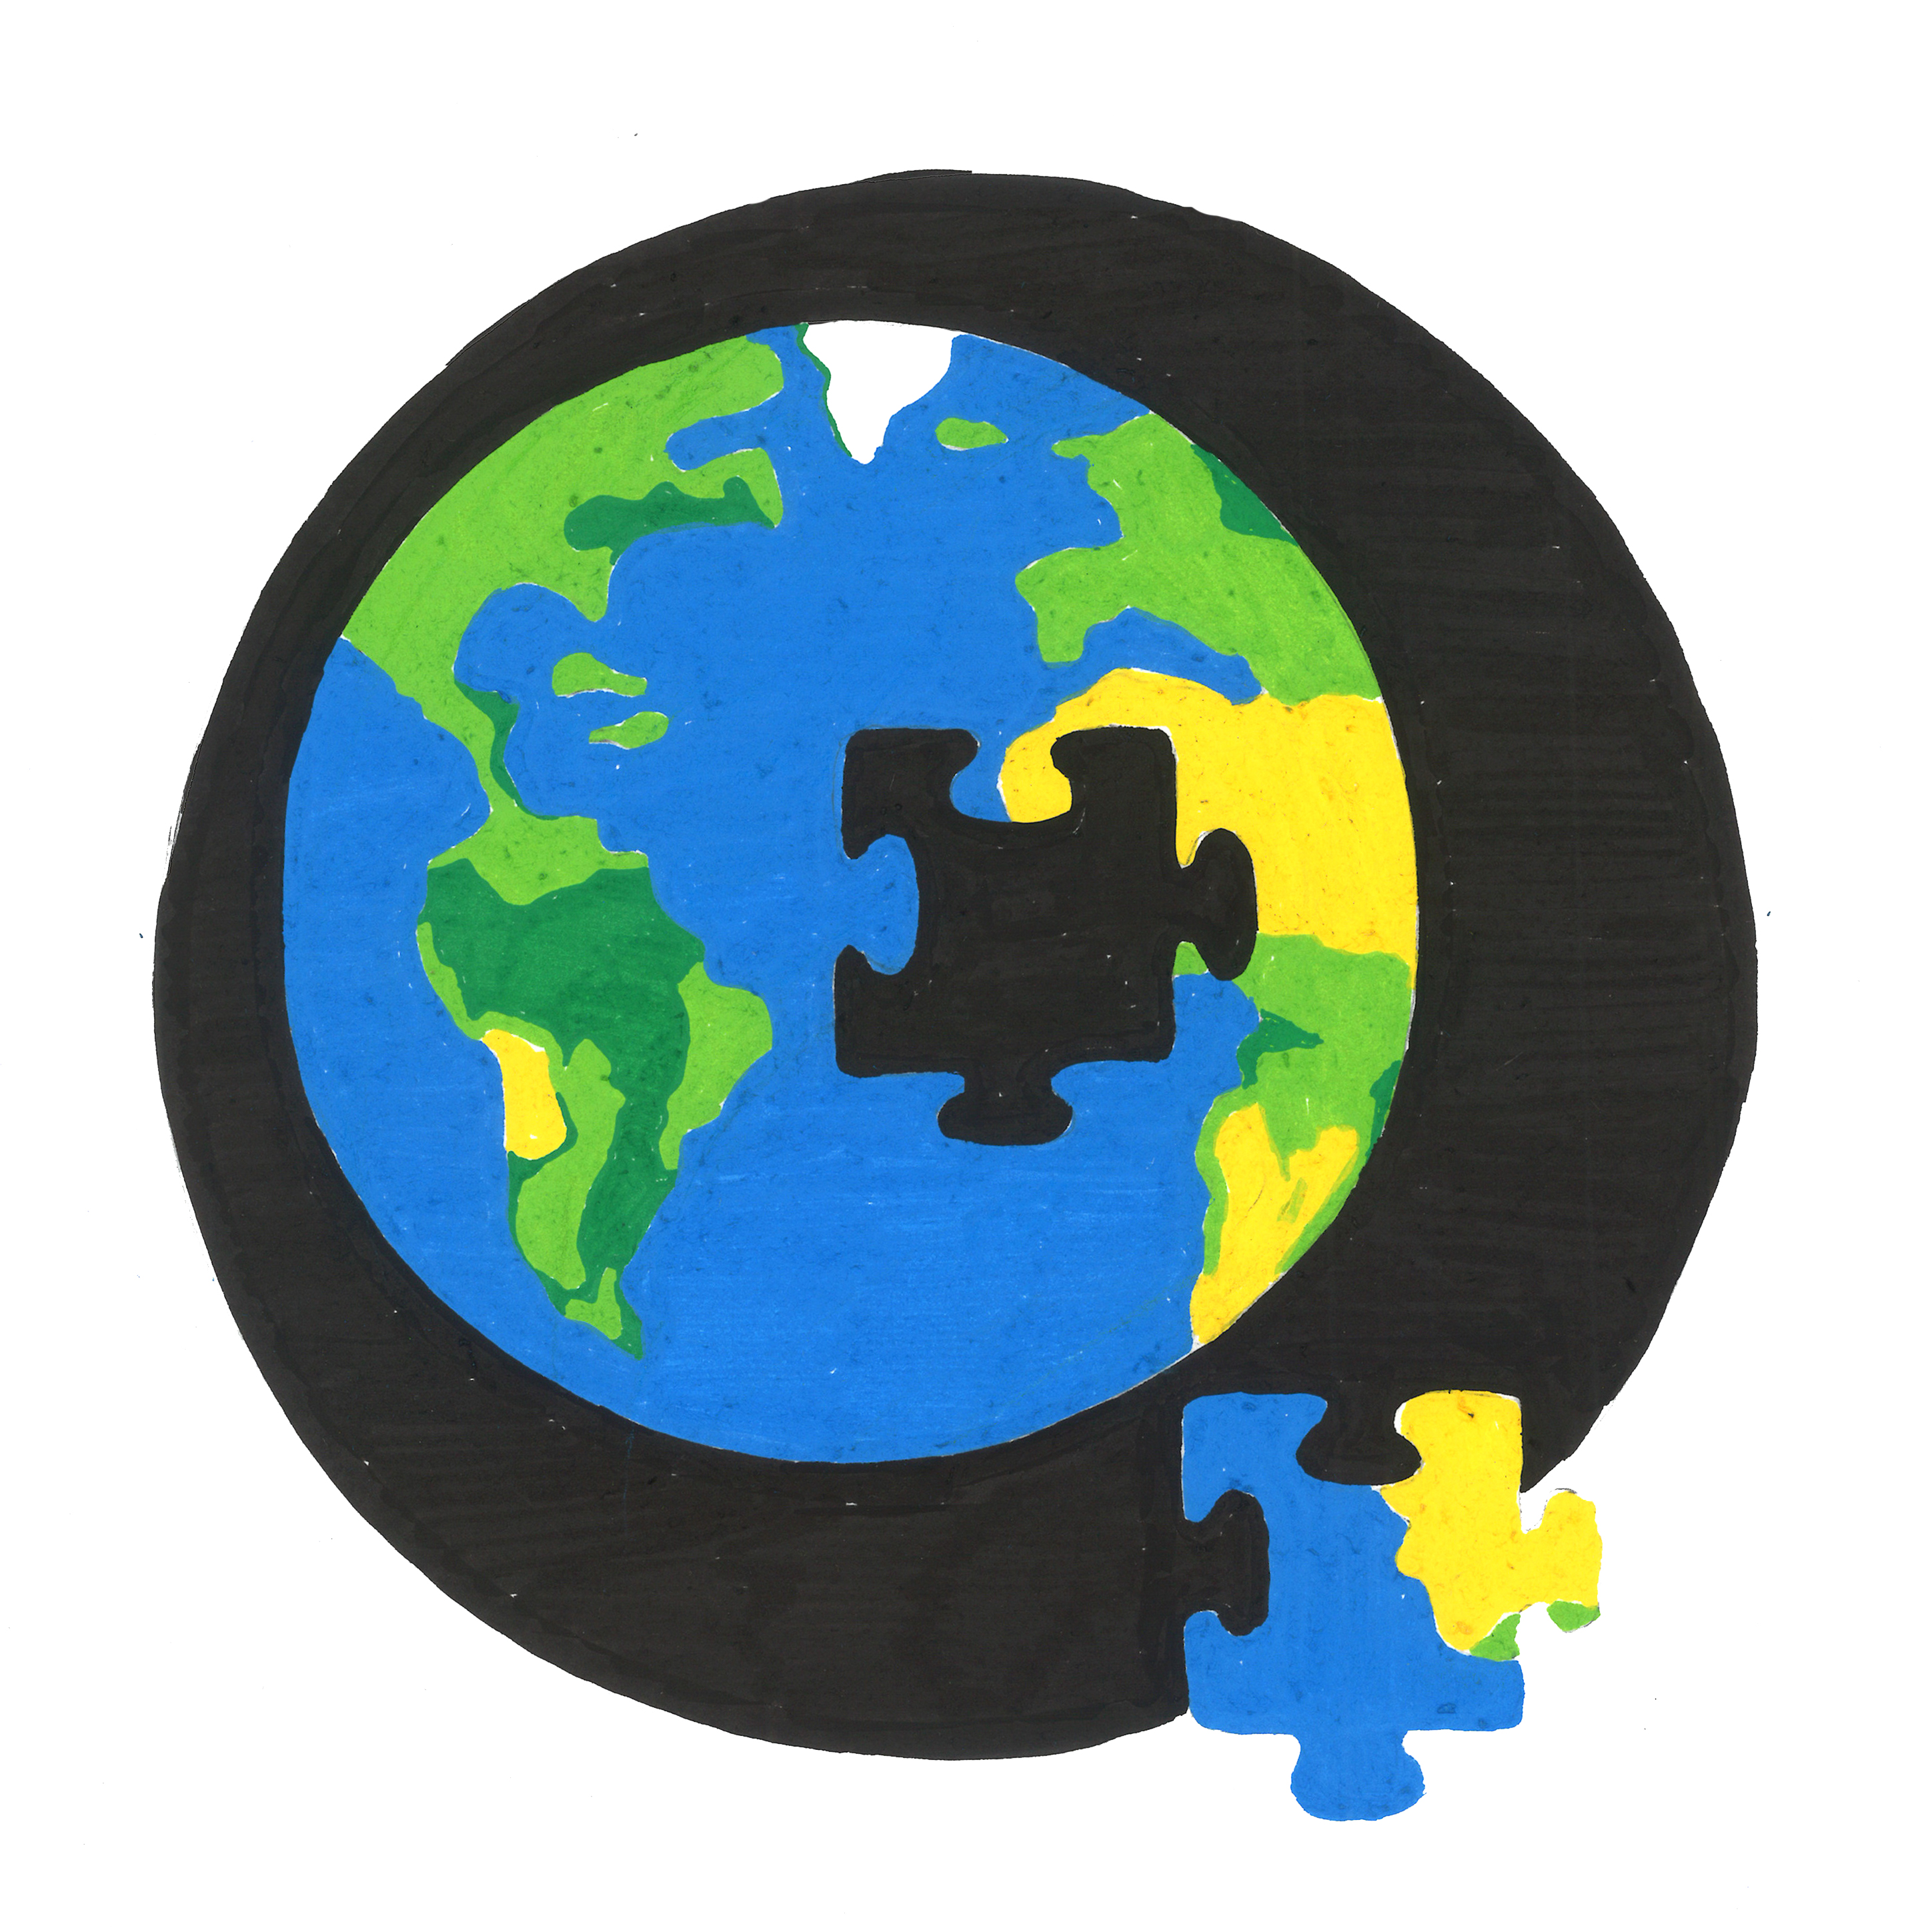
Science: more than just solving a puzzle
More than half of the process is spent on actually identifying and organising the puzzle pieces
Everyone who has ever solved a puzzle knows the following technique. Your
puzzle is square-shaped. First you identify the four corners. They are easy to recognise
and it gives you a rough idea of the orientation of the puzzle right in front of you.
Then you take care of the foundation, the sides. The sides tell you something about
the size of the task at hand. Then you start sorting out the colours. This is the
toughest and least interesting process. But you know that after you have spent all
this time on this preparatory work, you will spend less time collecting the pieces.
All of a sudden, you will be able to lay many more pieces in one go.
If you did not recognise the following with puzzles, then perhaps you could do so
when building with LEGO or even when putting together an IKEA kit. You do not want
to find out that when you get to the last few parts, a piece of the puzzle is missing.
At the moment, my model of the Earth is also a giant puzzle. I am looking at 287
unique combinations of surfaces including clouds over a range of 209 wavelengths.
If I include the four different phase angles as well, I will be looking at up to
240 thousand pieces1! That is a massive puzzle. Now you can probably imagine that
until yesterday I did not realise that I was still missing about 40 thousand pieces.
Fortunately, I found them all today! Now it's time for the final steps. First,
write a program so that my computer can solve this puzzle properly, and then do
the most important thing for a scientist: understanding exactly what is depicted
on the puzzle.
Oh, I forgot.. Did I already tell you that I still have two more of these puzzles to solve?
1 One puzzle requires about 3.5 TB of data storage.
Posts from April 2021
Programming is not about what you already know, but what you can find out
Murphy's Law: Anything that can go wrong will go wrong.
Three months. Ninety days. Twenty-one hundred and sixty-one hours. One
hundred twenty-nine thousand six hundred minutes. Aka 7,776,000 seconds of continuous
code execution before I found out that there was one (1) error(s) in my code.
Unfortunately, I can re-execute the entire code once again. "But", I tell myself
smiling with crooked toes, "I will never forget the importance of using the correct
data types again!"
Programming is based on a simple concept: The computer does exactly what
you tell it to do. However, it is not as easy as just asking Siri, Google or Alexa
a simple question. But if we cannot talk, how can we get a computer to do something
for us?
As programmers, we write a finite set of instructions to go from an initial state
towards a final goal. These instructions are referred to as an algorithm or program
and are written in a simple text editor. A general text editor that many use is Microsoft
Word. However, this is not recommended for writing programs! I personally use the
PyCharm and the BBEdit text editor. Unfortunately, just writing a simple instruction
is not enough. To be able to communicate with a computer, we have to write it in a
specific language. A computer understands as much about a proper English text as I
understand the Hebrew language, which is nothing. Just as we have many different
languages in this world, there are also several languages available for computers.
Common and widely used languages are Python, Java(Script), C(++) and R. I typically
write programmes in Python programming language and in a somewhat older language,
called Fortran.
Well, and then what? We have the instructions, but how do we give those to the computer?
When programming in Python this is extremely simple. Python code is interpreted directly
by a Python interpreter that we use to run the program. Other languages require a compiler.
A compiler is a programme that converts the programming language into machine code,
which can then be executed directly by the computer's processor. Since there is no
extra interpreter between the code and its execution, working with a compiled code is much faster.
So why do we not all work with compiled codes. Well, writing this compiled code is a
bit more complicated. For example, at the beginning of each program, you have to specify
the type of each individual variable (string, integer, float) and you have to specify
the amount of memory you are going to use for storing these variables. In addition,
we can not actually read compiled code: Only the code that the compiler compiles is
human readable.
"Every advantage has its disadvantage", I think that a knowledge of several languages
will always come in handy. Just like in this world, you never know what you can
expect and where you will end up but you always want to be a little bit ahead of the game.

The polarisation of light: more than just an intensity
What is polarisation of light and what do sunglasses have to do with it?
The past couple of weeks, I have been working on the calibration of a polarimeter.
As the name suggests, the instrument measures the polarisation of light. So what exactly
is polarisation?
We describe light in terms of three variables: its brightness, its colour and its polarisation.
The brightness is a measure of the amplitude of light. We also call this intensity. Intensity
is what we measure with cameras. The camera expresses the intensity in a unit of counts which
we then convert into another unit: for example, flux. The colour of light is determined by its
wavelength1.
This wavelength cannot be directly measured. What I mean by this is that we can not infer the
wavelength of light by only using a detector but instead (in the case of wavelength measurements)
we look at diffraction patterns. Finally we have the polarisation, which is the direction of
vibration of the light. This direction is always perpendicular to the direction of propagation.
Thus, measuring polarisation is measuring this direction of the vibrations. Or more accurately,
measuring the percentage of waves that have this same vibration direction.
But how can you measure this direction of vibration? I just said that detectors in cameras can
only measure intensities. To explain this concept, I will give an example of Polaroid sunglasses
and 3D glasses below.
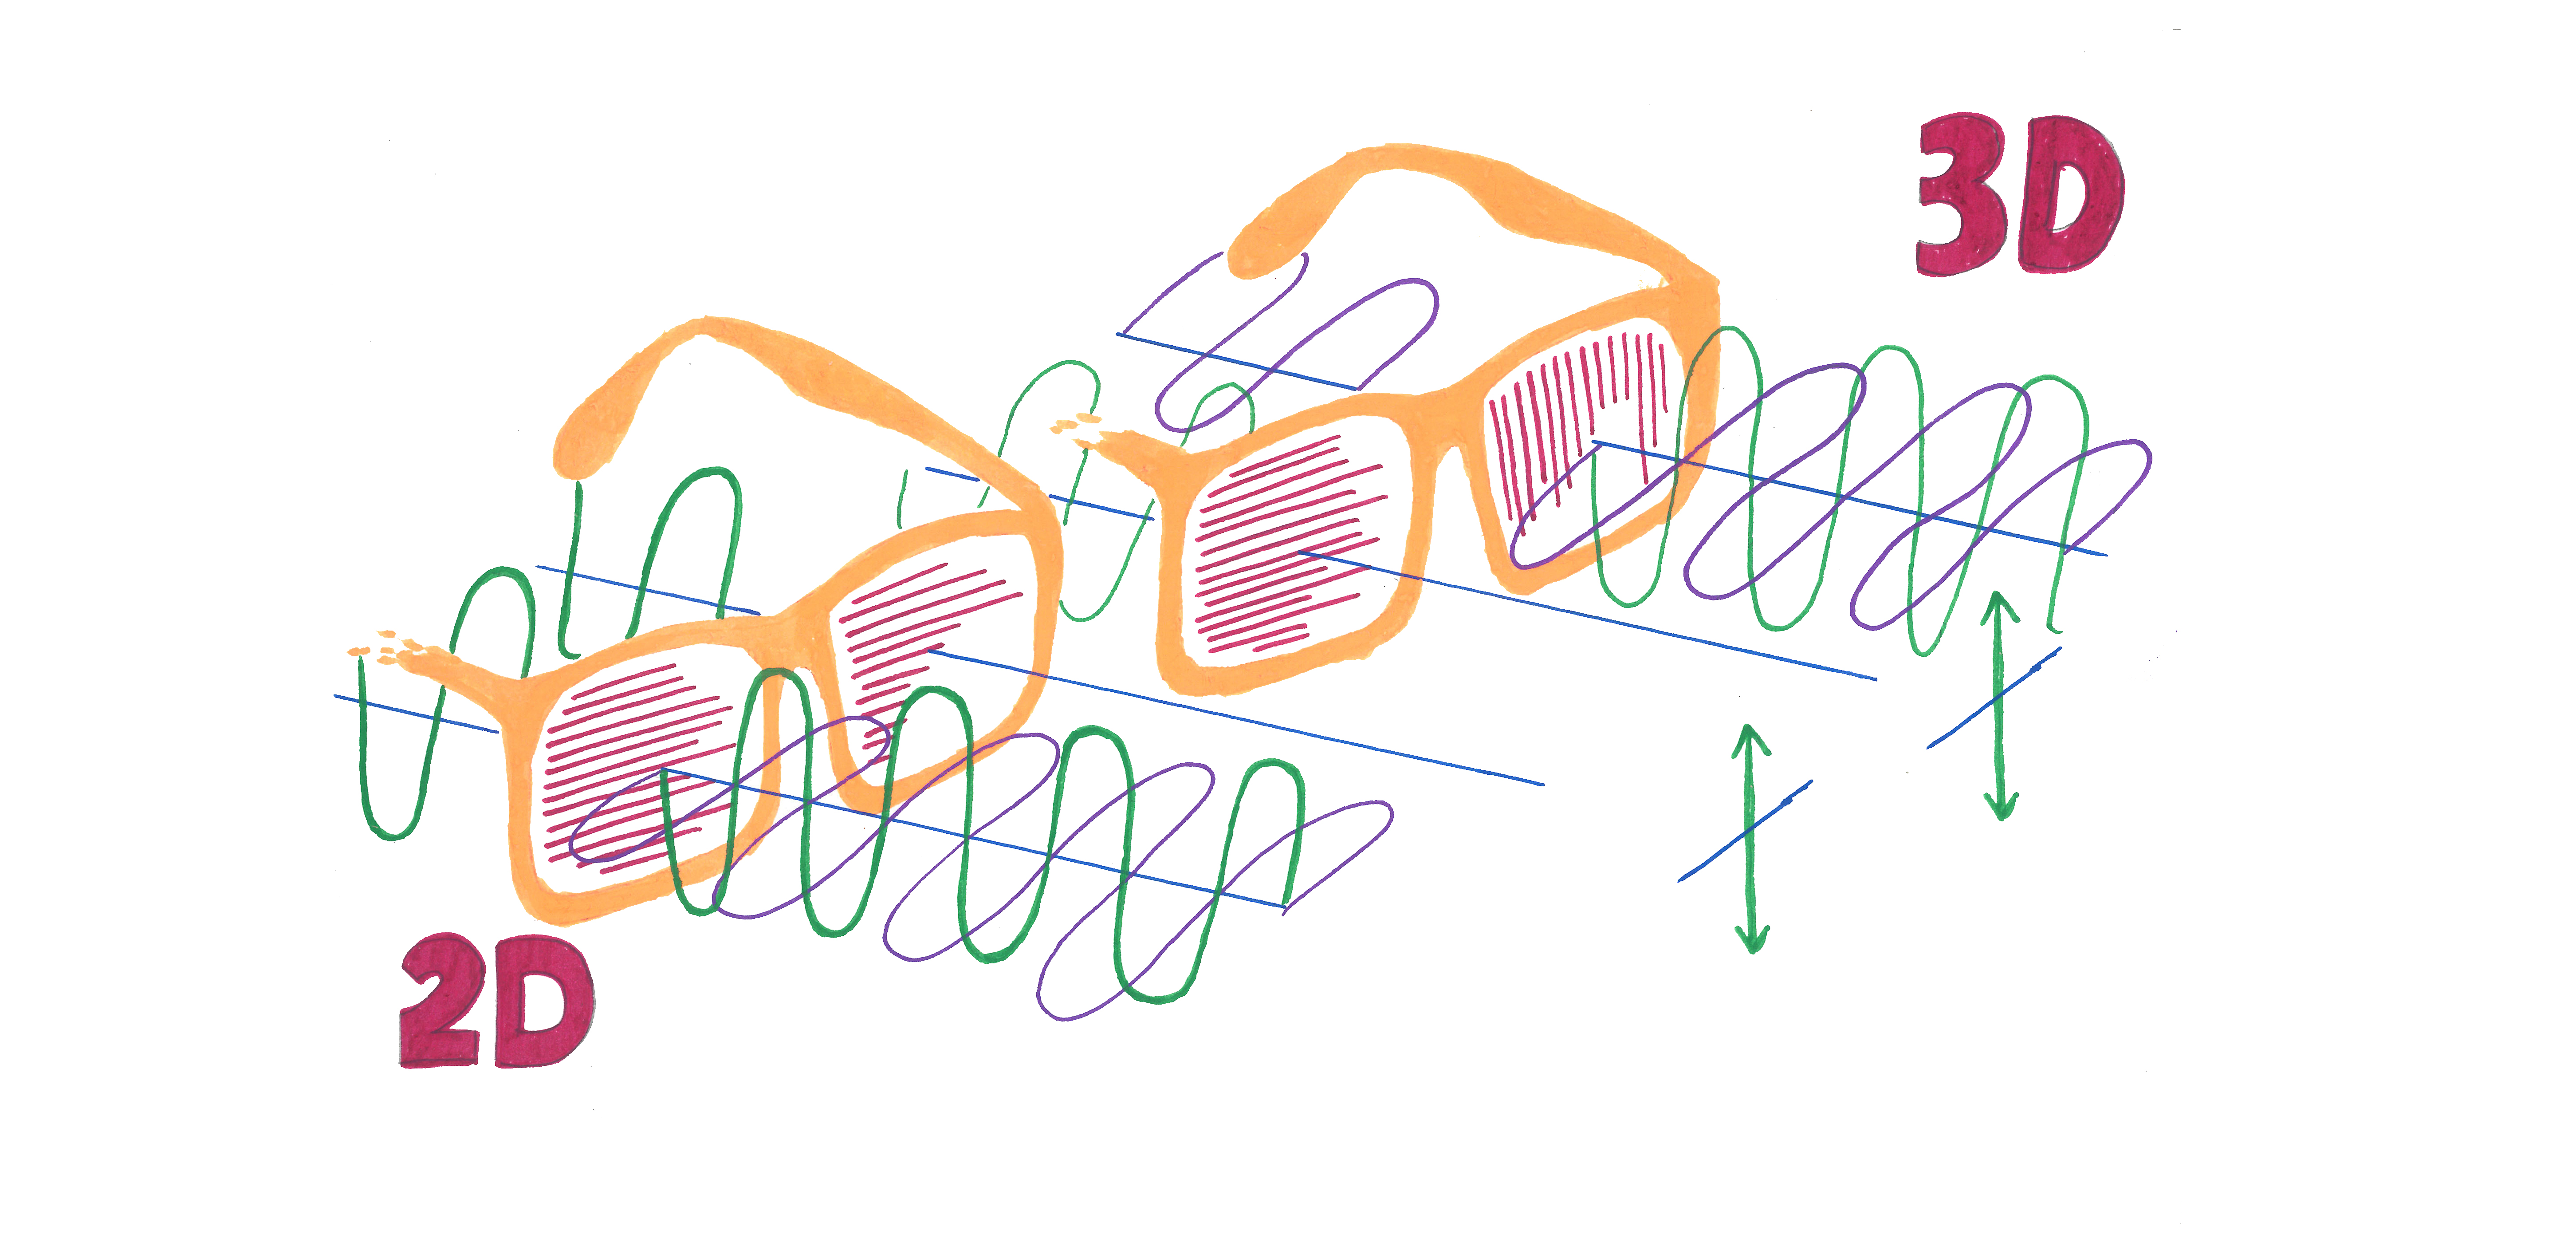 Polaroid sunglasses vs. 3D glasses •
The modulation of light.
Polaroid sunglasses vs. 3D glasses •
The modulation of light.
Sunlight consists of bundles of light rays that all have different directions of vibration.
The absence of a preferred direction causes this light to be referred to as unpolarised light.
Light beams from light bulbs are unpolarised as well. In contrary, laser light is often polarised.
This means that the direction of vibration of laser light has a preferred vibration direction.
This preferential direction can result in linear, circular and elliptically polarized light.
Usually, the light from lasers is linear polarised. In nature, linear polarised light is also
the most common type of polarised light.
But wait a minute... We just said that sunlight is unpolarised? How does (sun)light get polarised?
When light from the sun enters the atmosphere, its waves still have a random direction of vibration.
In the atmosphere the light can be scattered (reflected) by colliding with molecules in the air,
water and small dust particles (aerosols). This scattering is also called Rayleight scattering.
Rayleight scattering causes parts of the light to become polarised. When the sun's rays hit flat
surfaces, like water, snow and ice on the earth, part of the light becomes horizontally (linearly)
polarised. We see this with our eyes as a blinding glare. Polaroid sunglasses have a filter for
this specific horizontal linear polarisation. This makes the sunglasses improve vision and prevent
eye strain on sunny days.
But then what do 3D spectacles have to do with polarisation? 3D spectacles use polarising lenses
to create the illusion of a 3D image. Each of the glasses contains a different polarising filter.
With each filter, only light that is polarised in one direction will pass through. Light that is
polarised in the opposite direction is blocked. This causes both eyes to see a slightly different
image. This causes us to see the image with our two eyes from two apparent positions. As these
positions differ, the illusion of a 3D image is produced.
Keep an eye on the blog! Soon I will tell more about how I plan to measure polarisation!
1 See my post from January 19 for a more detailed explanation regarding
sunlight and its wavelengths.

Posts from March 2021
Meeting fellow colleagues during the pandemic
Working together on projects at the intersection of Earth sciences and astronomy
As a scientist, it is incredibly important to keep working together with
other scientists in your field. When multiple scientists work together towards an
overall goal, this is sometimes referred to as a scientific network. My project is
part of a specific network: the PEPSci programme.
PEPSci • Pepsi (cola) is known in the Netherlands as a tasty
soft drink. This is very similar to the name: PEPSci, a science programme that has
a completely different meaning in Dutch astronomy: "Planetary and Exoplanetary Science".
The initiative of the interdisciplinary PEPSci programme started in 2013. It is a
partnership where scientists combine their strengths and knowledge. They operate at
the intersection of earth sciences, planetary geology, astronomy and chemistry. Our
projects are roughly divided in two themes: "Building blocks of life: from disks to
exoplanets", and "Earth-like planets: from colliding pebbles to dynamic exoplanets".
Last Friday I met Christiaan, Elina, Orr, Tara and Vivian. Soon I will also meet
Alexandra and Mark online. (Actually, I happen to know Mark already from my Astronomy
degree). Together, we are an enthusiastic group of eight PhD candidates who, in the
next 3.5 years, will be looking at how planets (were) formed, how we can observe them,
and (importantly for me) what the signs are of possible life on these planets. I look
forward to it!
We are currently working on setting up a website and also contacting our predecessors!

The riddle of life's single-handedness
Searching for unambiguous signs of life
Despite the fact that we are in the middle of the COVID-19 pandemic, every
week a world is opening up to me. I discover more and more how many disciplines are
helping each other to answer important research questions. Especially when we are
talking about the definition of life there are many descriptions to be found throughout
the various disciplines. All together, these hopefully provide an answer to the question:
"What is life? This week, I went digging deeper into the biology and chemistry of 'life'.
Last week, I pointed out some of the signals of life that we can identify when
we look at the Earth from outer space. With the help of satellites we can find gases in
the atmosphere, water and vegetation on the Earth's surface and over a longer period of
time we can recognise the effects of seasons and even changes in the climate.
We are looking for planets that exhibit these same (bio-)signs of life. However, one
important and unambiguous1 sign of life is still missing from this list:
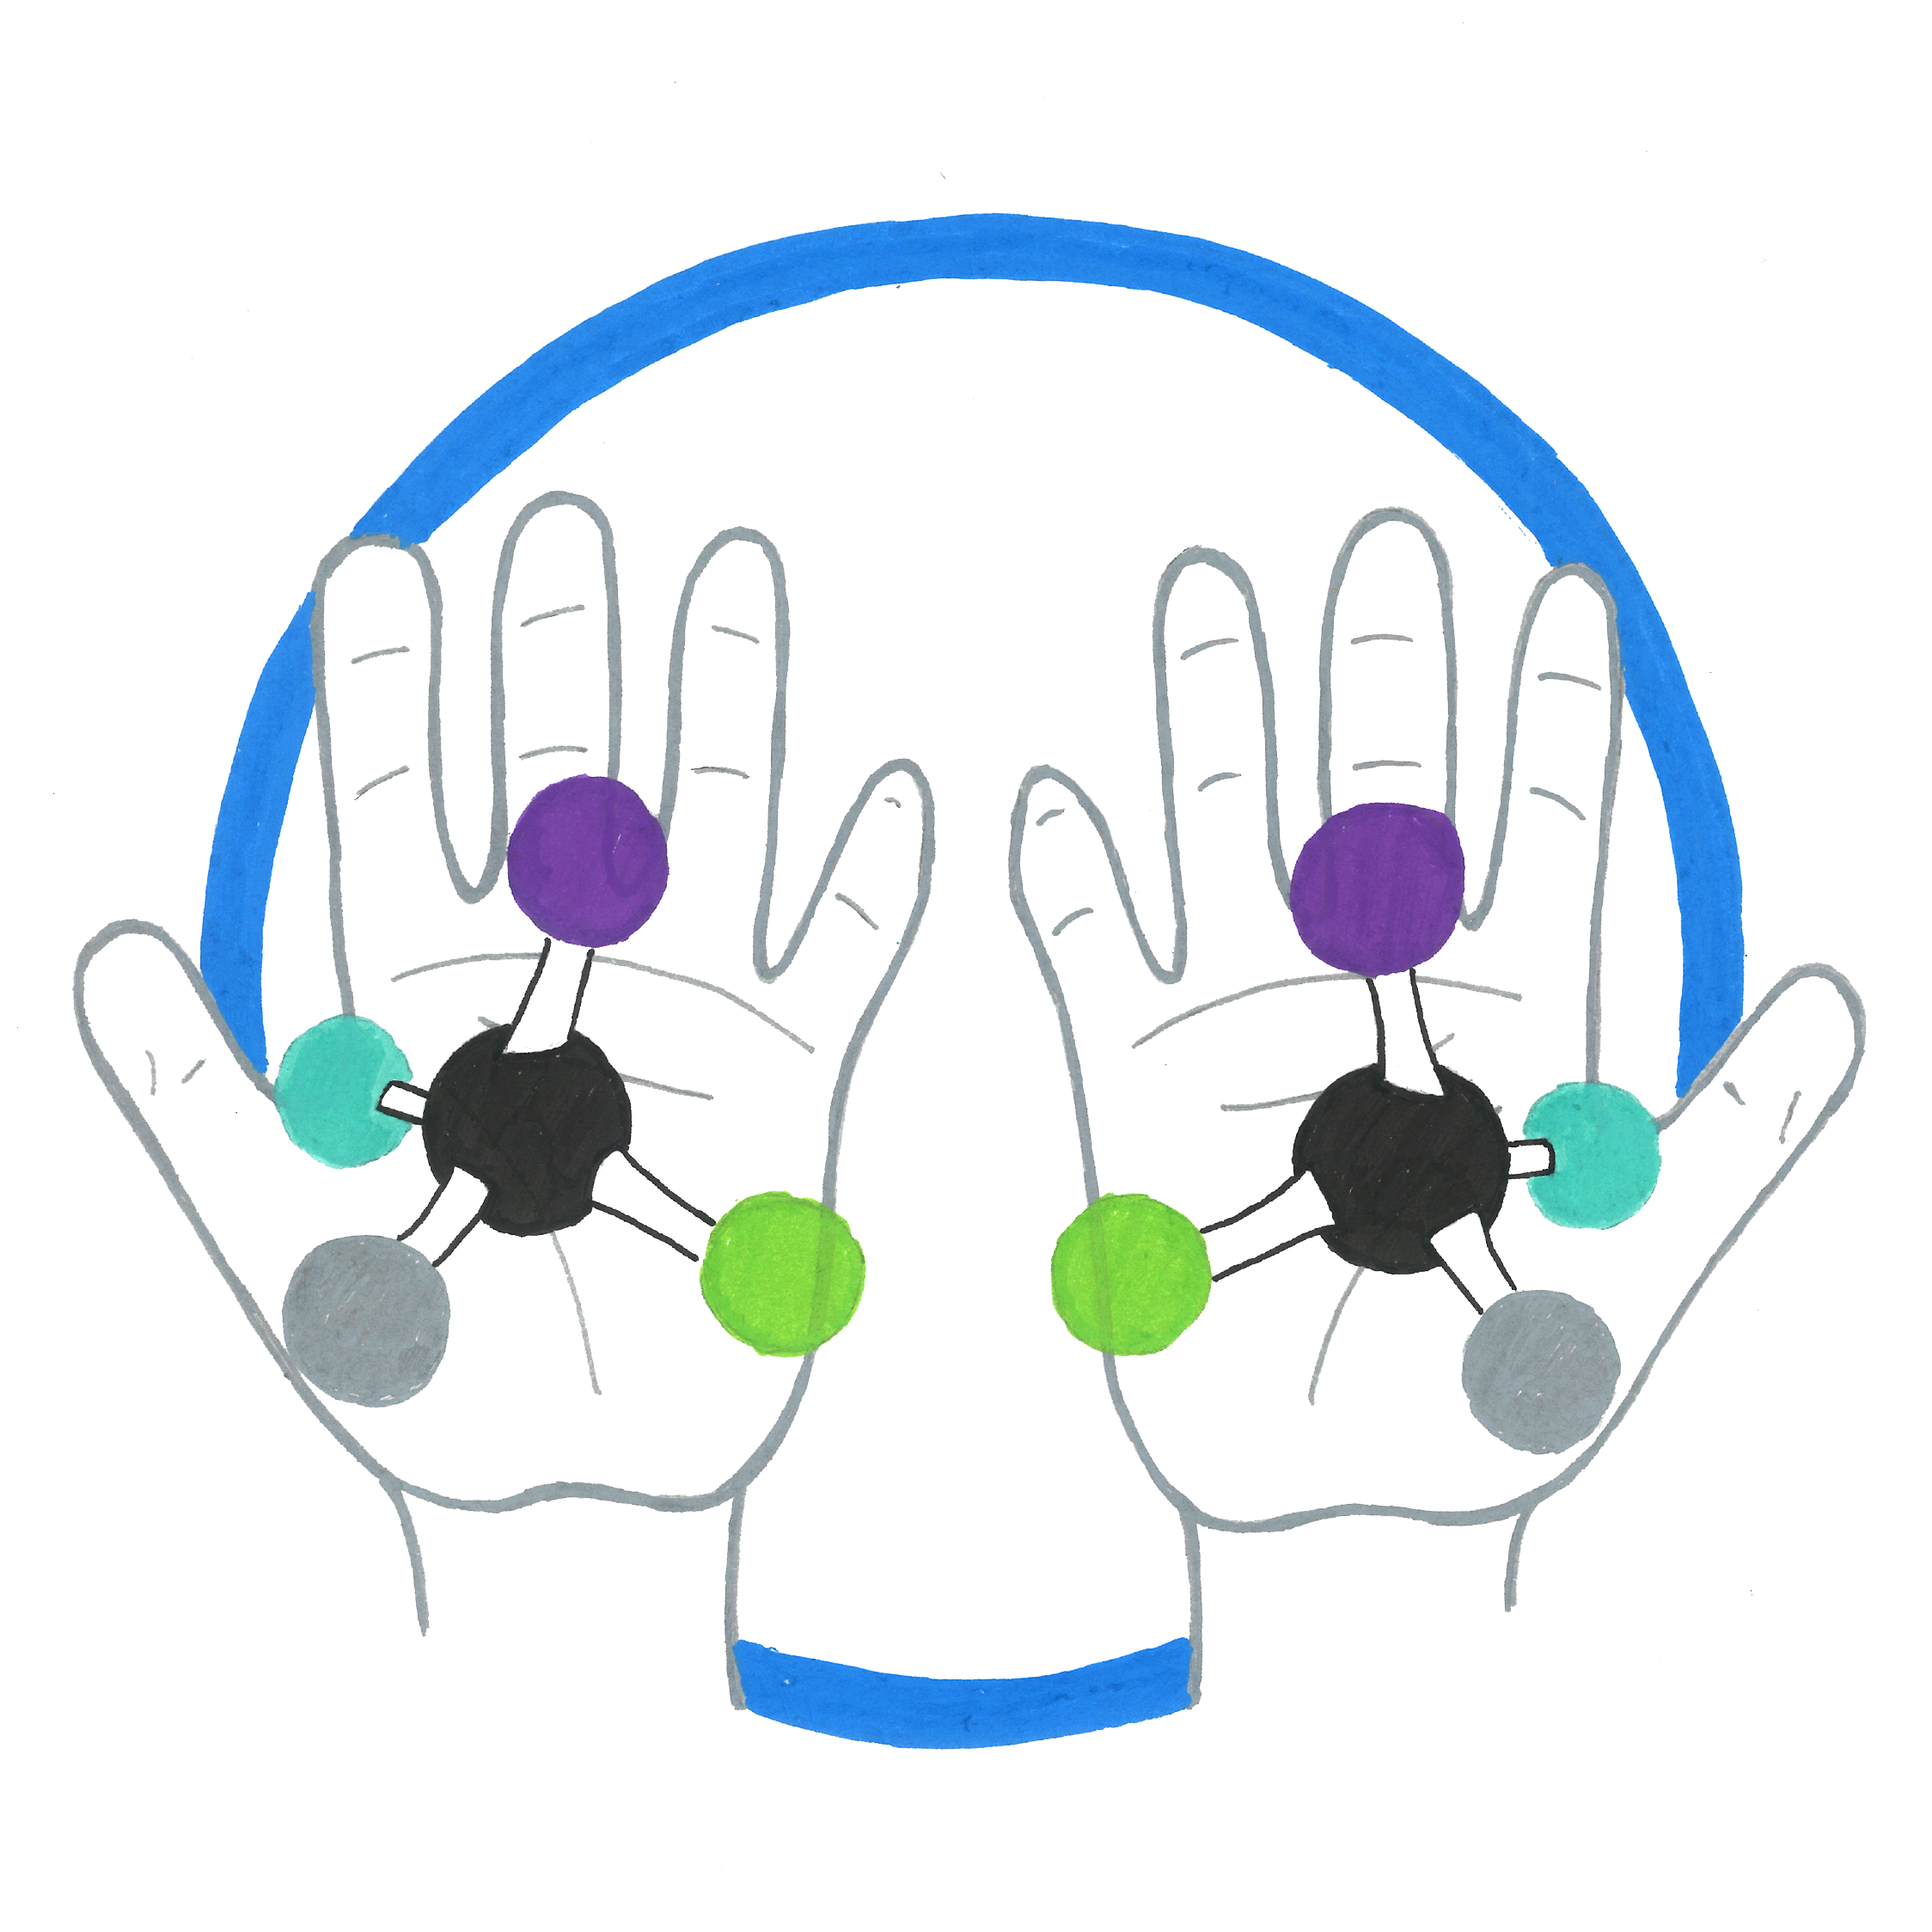
HOMOCHIRALITY.
HOMOCHIRALITY • the left- or right-handedness of molecules that are characteristic for life.
When you look at your hands, you find that your left hand is the mirror image of your right hand.
This makes your hands look the same. But when you put your two hands on top of each other,
you can see that they are totally different. You cannot put the two mirror images on top of
each other to get two left hands or two right hands. ( I do often say that I have two left
hands, because I can be very un-HANDY). Objects that cannot be placed on their mirror image
are called Chiral.
This is also known as asymmetry. However, there may be a preference for one of the two mirror images.
Looking at humans, almost 88% use their righthand as their writing hand. Initially, there is
just as much 'chance' that they would have used the left hand. This specific example is
dependent on many small genetic and other influences.
Om asymmetrische, chirale moleculen te onderscheiden zeggen we ook dat ze links of rechts-handig zijn.
Vanuit de theorie zou de kans op links en rechts-handige moleculen even groot moeten zijn.
Alleen blijkt uit onderzoek dat bijna alle chirale moleculen in levende organismen
in slechts één vorm gevonden worden. Uitsluitend links of uitsluitend rechts-handig.
Zo zijn de suikers die we vinden allemaal rechtshandig, aminozuren en proteïnen linkshandig en
DNA draait altijd rond in rechtshandige helices.
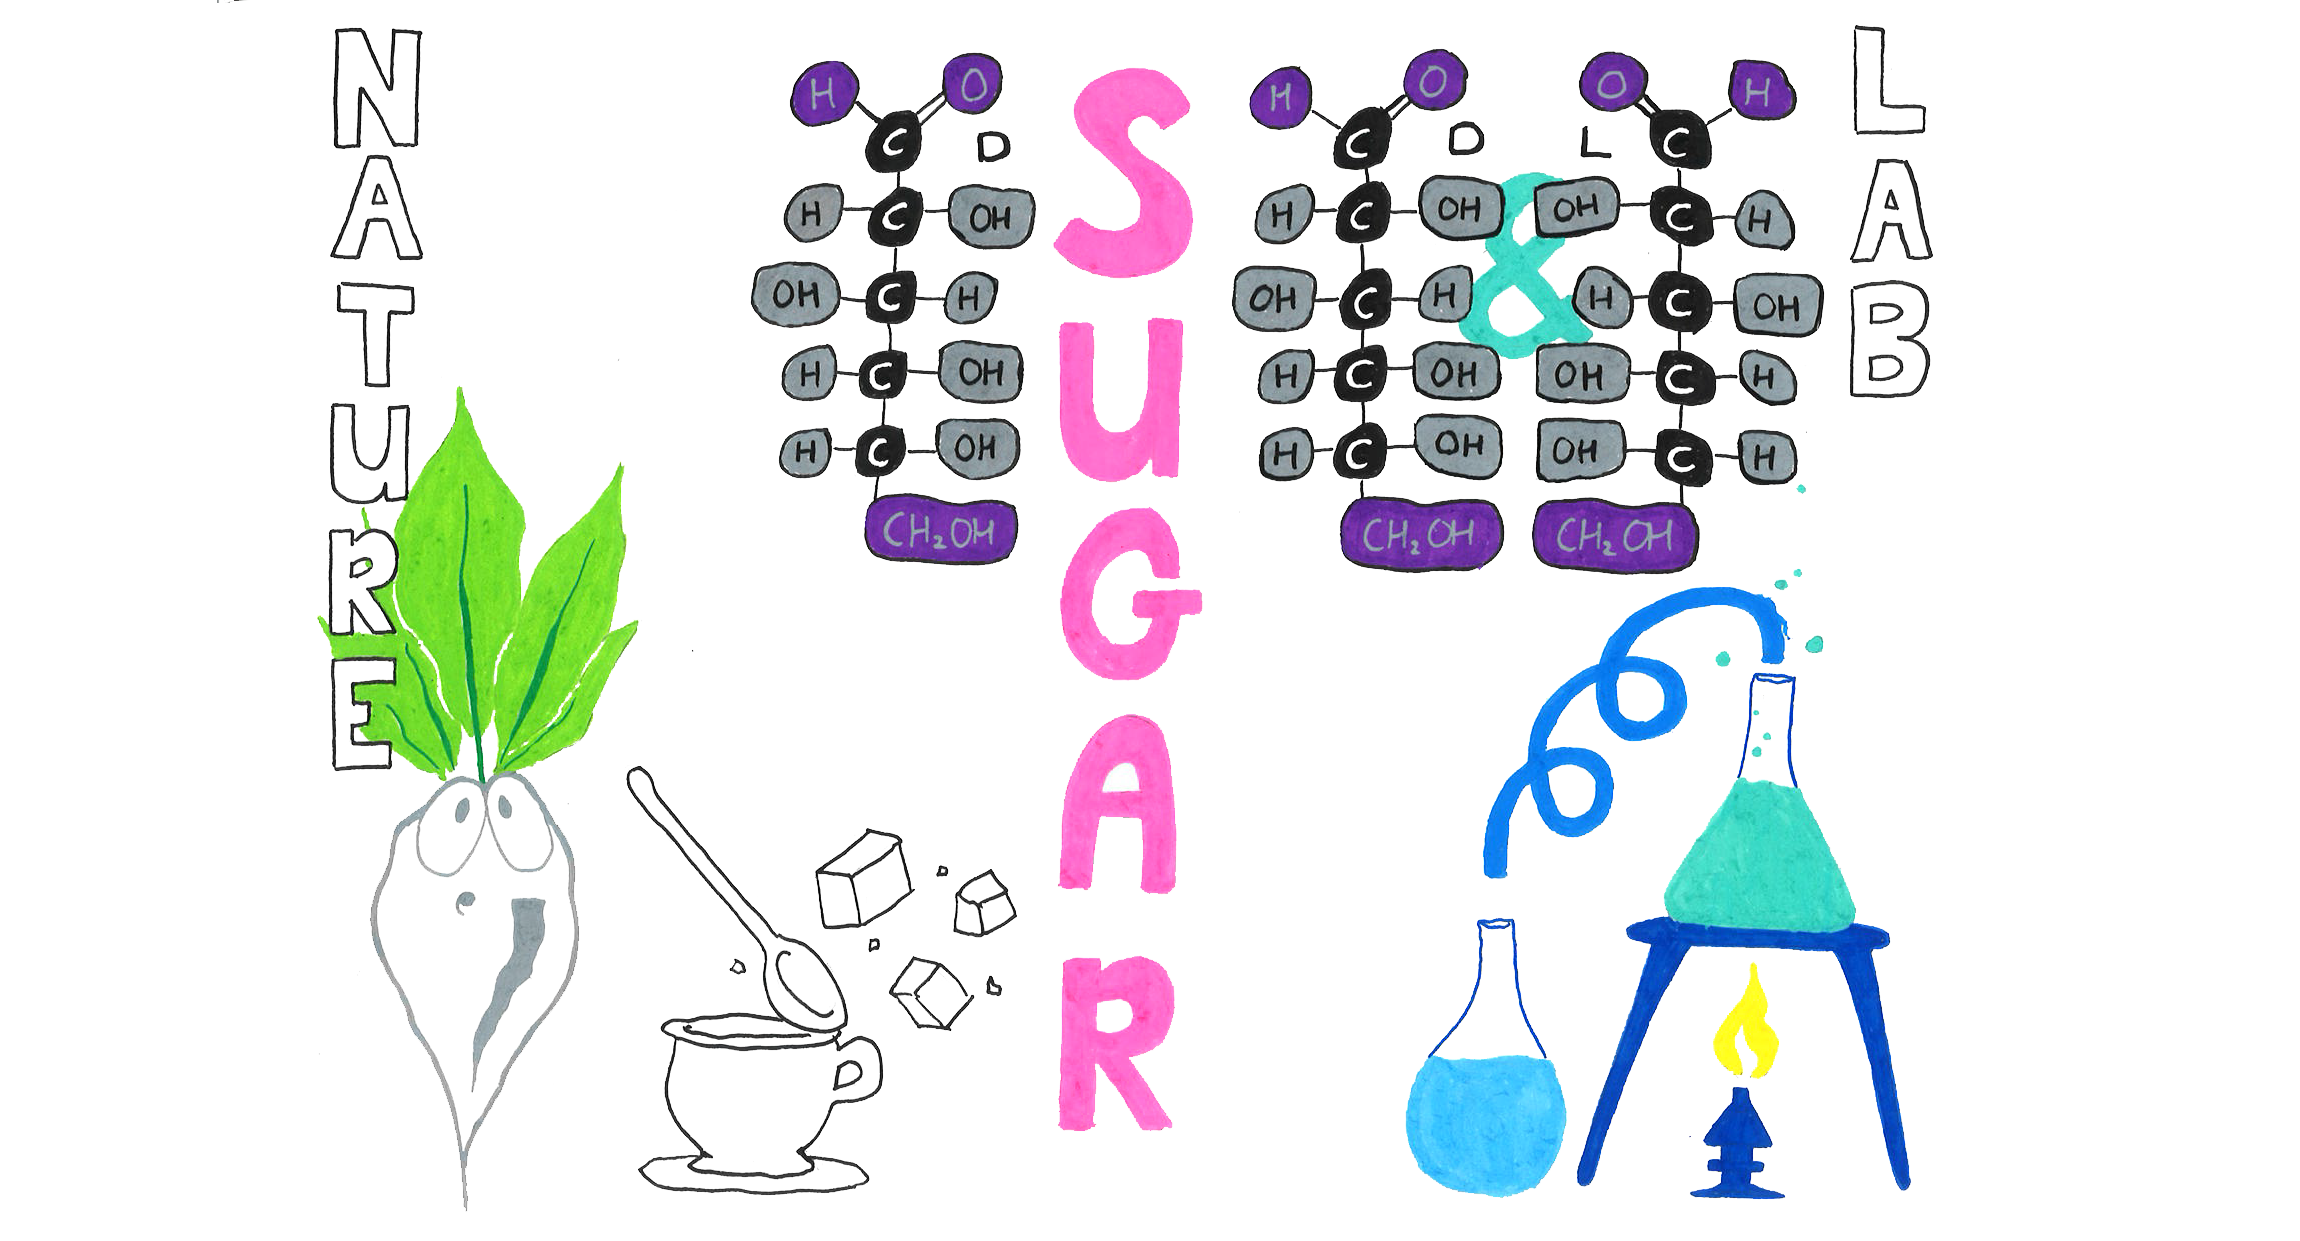
The drawing above shows an example of the glucose molecule, which is more commonly known as sugar.
In the lab we can produce sugar with the help of chemical processes. According to probability calculations
these sugars will consist of 50% left-handed (L-glucose) and 50% right-handed (D-glucose, also known
as dextrose). Although L-glucose and D-glucose are simply each other's mirror image, they are quite
different. Our body can not do anything with the left-handed sugars. L-glucose tastes as sweet as D-glucose,
but we can not obtain any calories from it. This molecule can be harmful to your liver, but it can also
be kept in your intestines, where it causes fermentation. That is not so good. But have no fear: life on Earth
takes good care of us! ALL the SUGAR we find in nature is pure D-glucose. This sugar is converted into energy
in our bodies. Every cell in the human body needs this energy to perform the metabolic functions that support
life. Therefore, the existence of only D-glucose in nature is considered to be one of the signs of life.
1 Unambiguous means that if we find this, there is no other explanation than that there is life!
My research: looking for signals of life
My first moment of evaluation - my first presentation
Important lesson 3: Do not fear moments of evaluation in your life.
A time for reflection can give you a better understanding of what you want to achieve
and what you need to do in order to get there.
Whouw! Everybody has experienced those last 5 minutes before starting a presentation...
Did I prepare the presentation well?" "Do I understand the subject matter well enough?"
"What questions will they be asking?" All these questions and thoughts that dance
around in your head just before you speak your very first word out load.
Last Monday, I gave a presentation to the promotion committee. I told them about my
progress over the past six months, the knowledge I have gained and my plans for the
coming 3.5 years of being a PhD student. This was my first evaluation moment since
I started here in Leiden. That does make you a little nervous. Fortunately, everything
went well! I can continue the research that I started with.
With this post, I would like to share with you what the ultimate goal of (continuing)
my research: "To detect signals that could give us evidence of life beyond our Earth".
However, just observing signals is not enough. We need scientific evidence. Below, I
give some examples of signals of life that we know of, that can be recognised when we
look at the Earth from space.
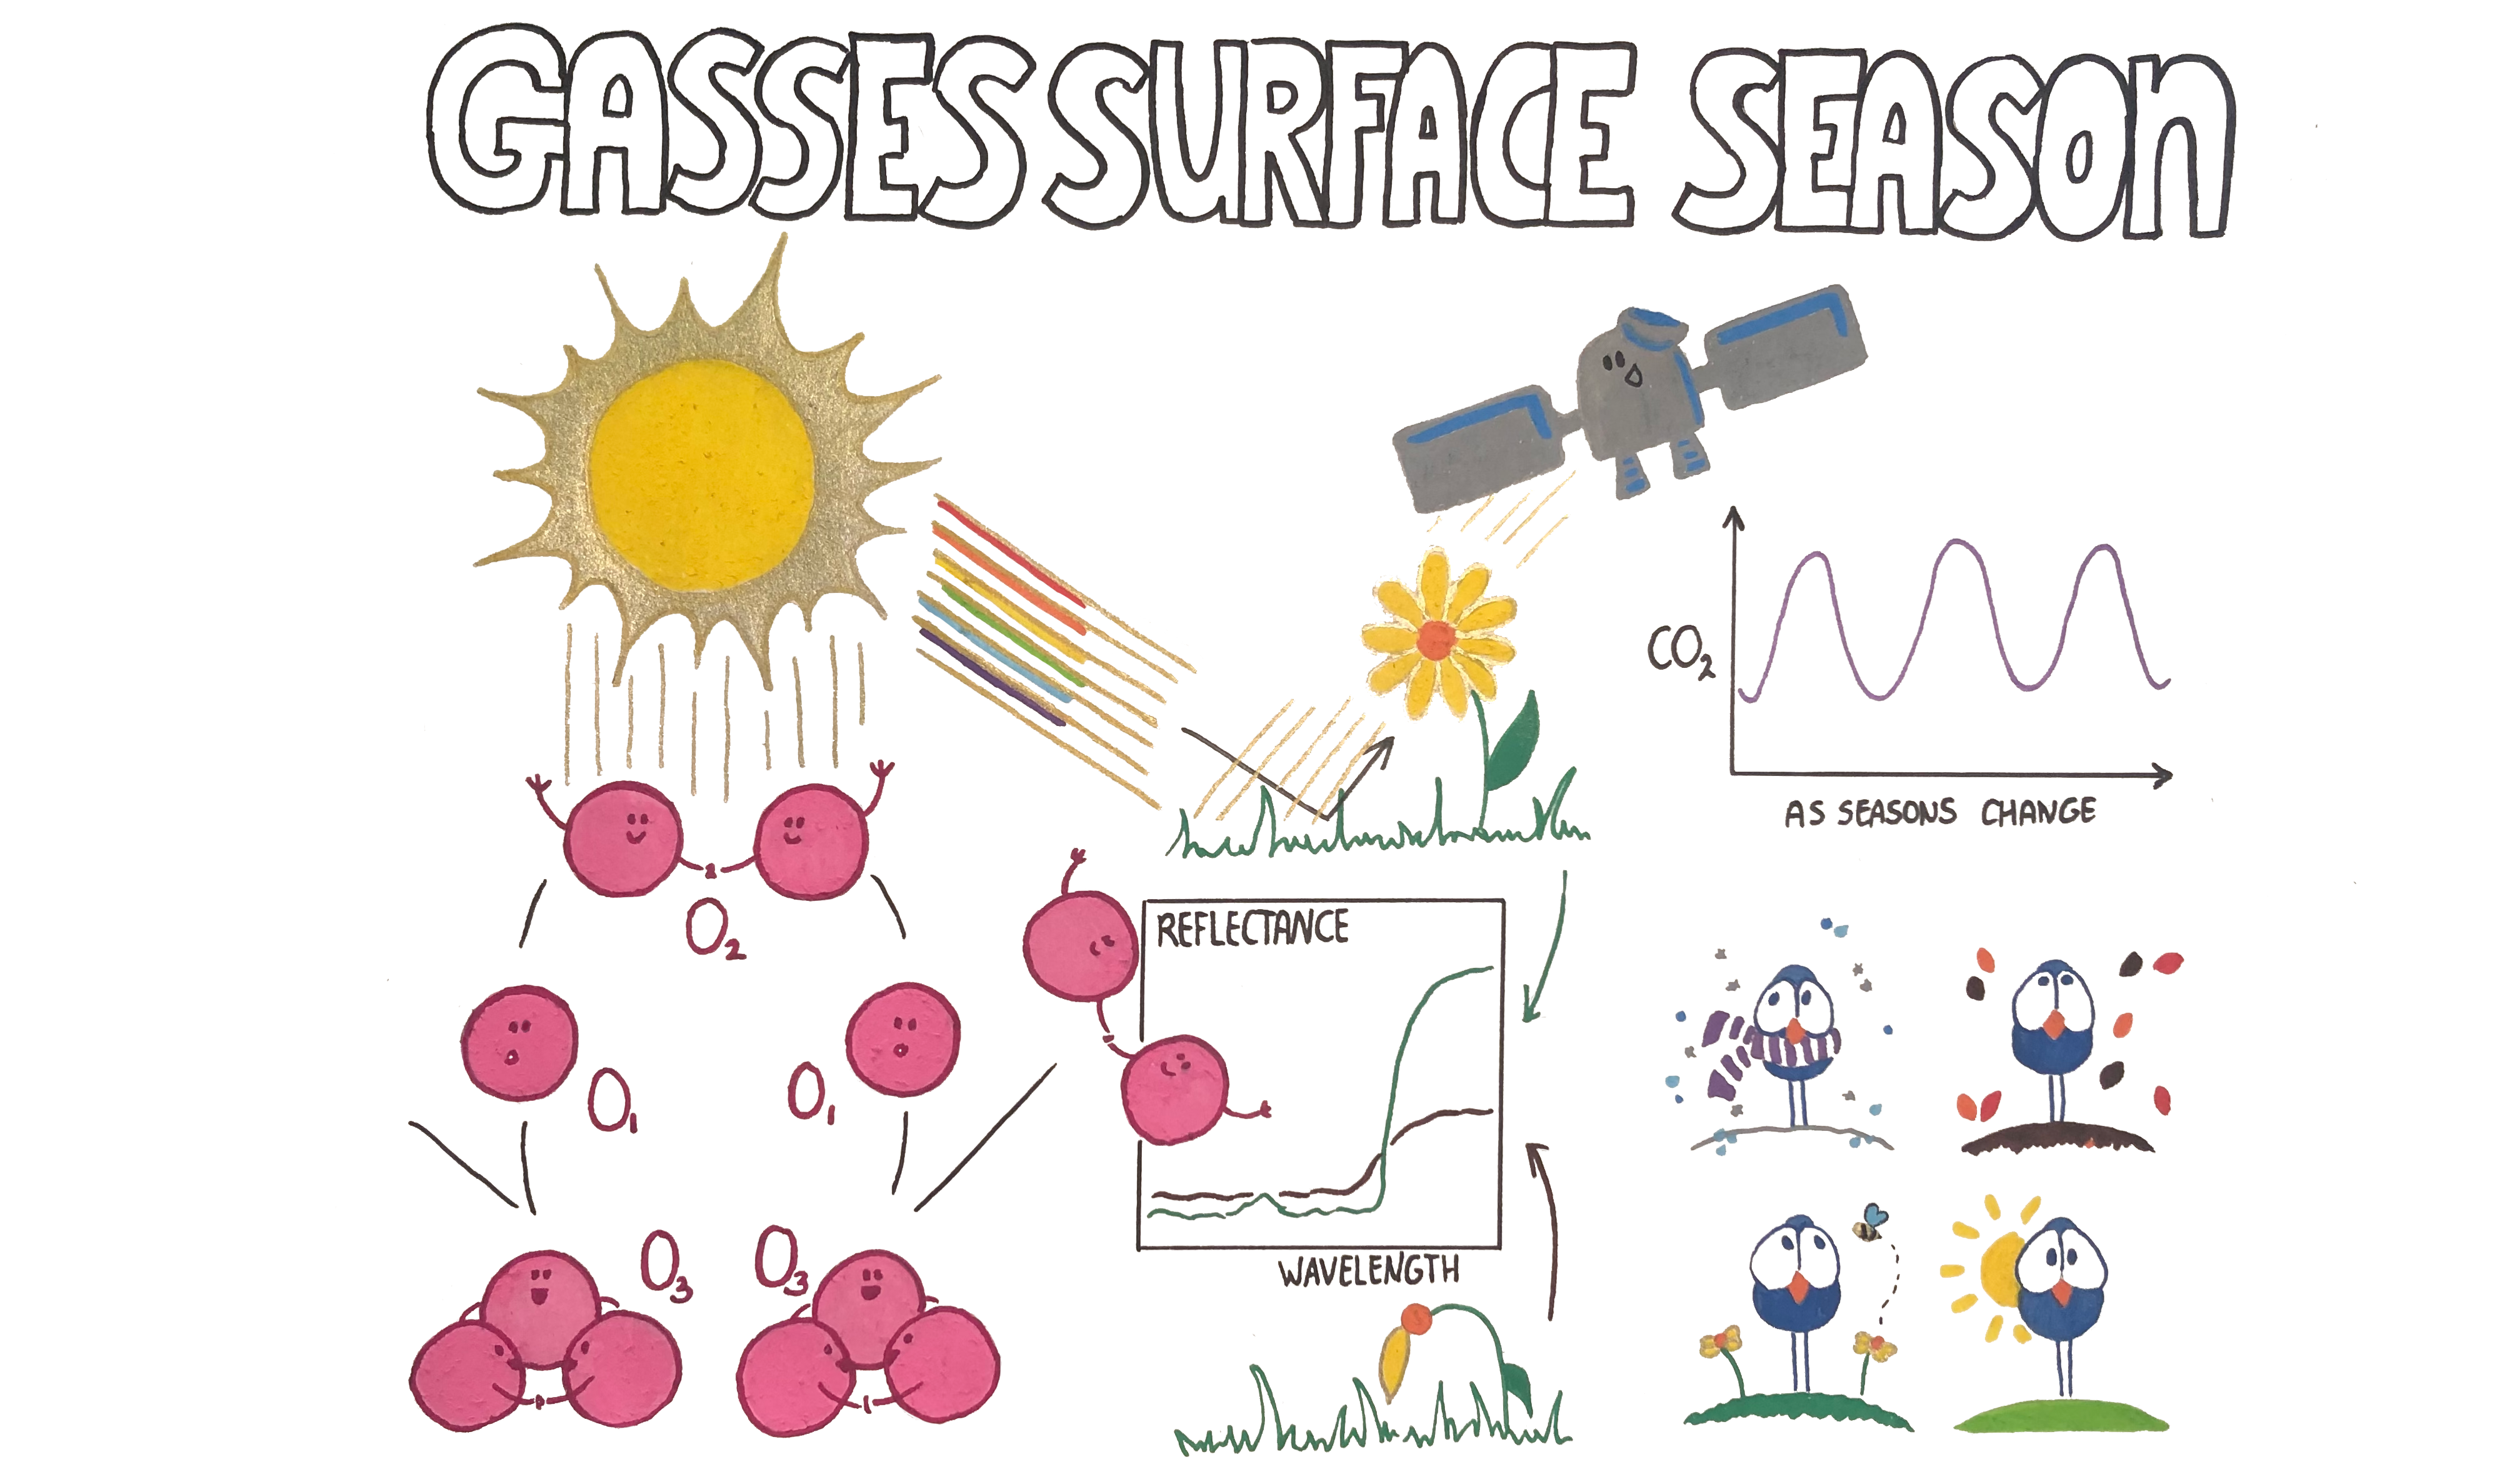 Bio-signatures of life on Earth •
"Are there other planets besides the Earth that contain life?" This is one of the
questions that astronomers are exploring. Throughout the universe we look for what
we call 'bio-signatures'. This is a collective term for elements, isotopes, molecules
or phenomena that are considered scientific proof of life. In the drawing above, a
selection of these evidences are categorised in gasses, surfaces and seasons.
Bio-signatures of life on Earth •
"Are there other planets besides the Earth that contain life?" This is one of the
questions that astronomers are exploring. Throughout the universe we look for what
we call 'bio-signatures'. This is a collective term for elements, isotopes, molecules
or phenomena that are considered scientific proof of life. In the drawing above, a
selection of these evidences are categorised in gasses, surfaces and seasons.
- Gasses in the air - The Earth's atmosphere consists of a mixture of different gases. The two most common gases are nitrogen (78%) and oxygen (21%). Oxygen gas, O2 is produced by photosyntheses (plants) and ensures that we -people & animals- can live. Unfortunately, finding oxygen in an exo-atmosphere alone is not hard evidence for life. Research has shown that oxygen has to be present in combination with a number of other gases before we can call it a proof of life. One example concerns the presence of ozone gas (O3). Ozone is made from oxygen in the stratosphere. The ultraviolet radiation from the Sun is so powerful that when its photons (light particles) collide with an oxygen molecule (O2) it splits into two loose oxygen atoms (O1). Together with one other oxygen molecule, this single atom combines to form an ozone molecule (O3).
- Reflection of surfaces - Different Earth surfaces reflect sunlight in different ways. One reflection effect that we recognise from Earth observations is the so-called "red edge" effect. Plants absorb the green part of sunlight and reflect the red part. This causes a strong increase in reflectance in the red part of the visible spectrum1: around 700-750 nm. However, we only see this effect when plants are alive. As soon as plants die, this sudden increase reduces its intensity.
- The effect of seasons - The position of the Earth in relation to the Sun defines the seasons. Because the Earth revolves around the Sun once a year and the Earth a little tilted, all seasons pass by in one year as well. The temperature differences between the seasons make that the Dutch winters are colder than their summers. This causes trees to fall into a kind of 'hibernation' and to lose all their leaves. In summer, the blooming trees & plants are able to convert carbon dioxide (CO2) into oxygen well (see point 1.). In winter, this happens less efficiently. This is why we can see variations in the concentration of CO2 in the atmosphere during one year. This is an indirect consequence of 'life' on Earth.
1 See my post from January 19 for a more detailed explanation regarding sunlight and its wavelengths.
Posts from February 2021
Top-Hat of Down-Hat? Remote teaching!
To set priorities: an important lesson
Important lesson 2: As a researcher, you never know what will come across
your path. Every week is another week where we have to look again at what has top
priority at that particular moment.
I took this lesson quite seriously. On the first Monday of February, I broke my arm
and I knew I had to work with one hand for at least another three weeks. The conclusion:
no instrumentation in the month of February, working less efficiently and asking more
help from others. Fortunately, as a researcher, there are always things you can do
(with a little help)! An important example is: teaching!
Over the past four weeks I have been standing in front of a classroom for the first
time. Or rather... More... Sitting in front of my laptop? It is so fascinating and
exciting to be on the other side of the classroom for the first time in my career.
Suddenly, you are the teacher explaining and not the student asking the questions.
I was nervous, but in the end it turned out not to be necessary.
What does my schedule look like now I am also helping with teaching? On Mondays from
08:00 to 13:00 I start with correcting the students' homework. I then take until 13:30
to put all the marks with their feedback online. After a break from 13:30 to 14:00,
the lesson begins and then from 16:00 to 18:00 students can ask for help with their
homework. In addition to these Mondays, I spend about an additional day per week
preparing and answering questions.
The course: High Contrast Imaging •
How can we observe a small planet that is next to a super large and bright star?
We can do this by blocking the light from a star. This month we looked at how we can
do this using the computer and at the telescope. Using the computer, we can, for example,
reduce the star's signal with a kind of filter: a 'Top-Hat/Down-Hat Kernel'. At the
telescope it is possible to use a coronagraph to reduce the signal coming from a star
during an observation.

Posts from January 2021
LOOKING AT FINGERPRINT OF GASES (LIKE THE SUN!)
Why is the sky blue and not black like the rest of the universe?
This week I was studying very small particles (that make up gases) in our air.
We call these particles molecules. Many molecules make up the gases in our atmosphere.
Last week I talked about the fact that light waves can collide with these molecules.
Every molecule, every gas, can block/absorb very specific parts of light. So actually
we can say that gases absorb certain colours of light better than other colours.
This causes so-called absorption lines.
In astronomy we use these absorption lines to look at the ingredients of stars and gas clouds.
Stars, after all, are super-sized balls of hot gas. Just like on the Path a Like any star,
the Sun is made up of different gases. When we use a prism to break up a thin ray of sunlight
into all the different colours of the rainbow, we see a number of black lines. These are the
absorption lines from gasses of the sun. By looking at the location of these black lines in the
light spectrum, we can see which molecules cause these lines. This is how Pierre Janssen discovered
that the Sun is made up of the gas Helium. Because each type of gas causes a different dark line,
we can link a star to a unique combination of black lines, a kind of barcode. Because this barcode is
unique, I also like to call it a fingerprint.
So... I want to calculate how much light is reflected on the surface of the Earth.
To do this, I first need to know how light travels through all the layers of the atmosphere.
The air in the atmosphere consists of many gases (oxygen, water, ozone) that block light from the Sun.
By calculating how much gas there is in a layer, we can make a unique fingerprint of our own atmosphere.
Using this fingerprint I can calculate how much light I expect on the Earth's surface.
But how does the atmosphere ensure that we have a beautiful blue sky? Read more about that below!
 Why is the sky blue? •
If we compare red light with blue light, red light has a longer wavelength than blue light.
Therefore, the chance that blue light collides with molecules in the air is greater than for
red light to collide with the molecules. The collided blue light is reflected in all directions,
which we see on the Earth as a beautiful bright-blue sky!
Why is the sky blue? •
If we compare red light with blue light, red light has a longer wavelength than blue light.
Therefore, the chance that blue light collides with molecules in the air is greater than for
red light to collide with the molecules. The collided blue light is reflected in all directions,
which we see on the Earth as a beautiful bright-blue sky!
Now for an explanation with a little madness: I like to think in pictures, as a sort
of mnemonic device. This week I came up with the idea of explaining the principle of
the blue sky with the help of the game Angry Birds. As a player, you can shoot
coloured birds at little pigs. Each bird has its own characteristics. The red ones are
big and heavy and the blue ones are small and light. Therefore, I see the red ones as
long big waves and the blue ones as short small waves. If we both aim the red and blue birds
(photons) at the piglets (air particles), we have a greater chance of hitting the piglets with a smaller wave.
As soon as the blue birds hit a piglet, the blue birds are multiplied in all directions.
In this way everywhere in the sky, and everywhere on earth, we will see more blue birds than other birds. Like a blue sky.

What is important when you make a computer model of the atmosphere?
One model for each layer in the atmosphere
In my previous blog, I shared a bit of background information about a project I
am working on: creating a computer model of our Earth. I am investigating how light
from the Sun is reflected on the Earth's surface and sent back into space. By 'measuring'
this reflected sunlight, I can simulate taking a special photograph from outer space.
For example from the point of view of a satellite.
The amount of light reflected from the surface of the Earth depends on several factors:
- surface albedo. This indicates the 'whiteness' of the surface. White surfaces such as ice, snow and salt plains bounce off much more light than dark surfaces do. Black is the darkest colour and reflects no light at all. Examples of black surfaces are asphalt and lava rock. Not only black but also other colours like green (forests and grass) and dark blue (oceans) do not reflect all the sunlight.
- clouds. In the Netherlands we know very well that there can be plenty of clouds in the sky and that they block the light coming from the Sun. The KNMI provides a very nice description of many different types of clouds at their website. We describe the amount of light that can still shine through a cloud by a number that we refer to as the optical thickness. This depends on the type of cloud particles (mini water droplets or ice crystals) and the depth of the cloud. A cloud can both absorb and reflect light.
- air molecules. The air we inhale every day is made up of very small particles, called molecules. These molecules can also block parts of the sun's rays. As in the case of clouds, we can calculate for these molecules how much light will be absorbed or reflected.
Because I am working on a model of the entire atmosphere, I need to understand the different layers of the atmosphere. In this way, I can compute how a ray of sunlight behaves when it travels through the atmosphere and how much Sunlight is being reflected.

Project ExoEarth: A computer model of the Earth
How to start in the absence of a lab? Well just.. with scientist in America
I started my research last September. The most famous observatories
from all over the world are closed due to COVID-19. Here in Leiden, the university
is partially closed with the laboratories, so I am working from home. I haven't met
all my colleagues yet, however fortunately being an astronomer there are enough
questions to keep me busy. For example, I started working on a project together with
my supervisor and scientists from America. We are making a computer model of the Earth
while pretending it to be an exoplanet.
Let's start with the question: "How is it possible that we can see planets?".
They do not produce light themselves like stars (like the Sun). Yet on 21 December 2020,
Jupiter and Saturn were clearly visible during their
'cosmic kiss'. This is because their surface reflects the sunlight. We can then
see and measure this reflected light from Earth. Now think about the Moon. The Moon
has craters, mountains and seas that we can see with the naked eye as little specks.
The amount of light that a surface can reflect is also known as the albedo, which means
'whiteness'. A pure black moon (or any other object with a surface, like planets)
would have an albedo of 0.0 and being white it would have an albedo of 1.0.
At the moment, I am wondering, and hence investigating, how light from the Sun
is passing through the atmosphere and reflected on the surface of the Earth.
To investigate this, I look at all parts of the sunlight. What do I mean by that?
Well, I break the light down like a prism into visible light, ultra-violet and infra-red.
In this way I can look at the light as if it were a sort of rainbow. Would you like
to know more about these different types of light? Read on below!
 Working with the spectrum of light •I looked up the word spectrum
in the famous Dutch dictionary called Van Dale and found the following description:
"range of colours produced by the decomposition of light, e.g. through a prism".
Light consists of many tiny electromagnetic waves that we can see with our eyes. The
length from one peak to another peak in an electromagnetic wave is called a wavelength.
We do not describe this length in metres or centimetres (cm), but in nanometres (nm).
One cm is exactly 10,000,000 nm. Light with a wavelength of 420 nm is known as violet
light. Light with a wavelength of 780 nm can be seen as red light. All wavelengths
between 420 and 780 nm are therefore called visible light.
Working with the spectrum of light •I looked up the word spectrum
in the famous Dutch dictionary called Van Dale and found the following description:
"range of colours produced by the decomposition of light, e.g. through a prism".
Light consists of many tiny electromagnetic waves that we can see with our eyes. The
length from one peak to another peak in an electromagnetic wave is called a wavelength.
We do not describe this length in metres or centimetres (cm), but in nanometres (nm).
One cm is exactly 10,000,000 nm. Light with a wavelength of 420 nm is known as violet
light. Light with a wavelength of 780 nm can be seen as red light. All wavelengths
between 420 and 780 nm are therefore called visible light.
There is more to the universe than just visible light. As soon as we can no longer
see electromagnetic waves as light, we call it radiation. Waves with a wavelength
greater than 780 nm (red light) are called infrared radiation and waves with a
wavelength smaller than 420 nm (violet light) are called ultraviolet radiation.
If the waves become even smaller we call them X-rays. Where do these different
types of radiation come from? Relatively cold stars (with a temperature of 4000 °C)
and planets emit infrared radiation. Visible light comes from stars as big and hot
as our Sun. Hot stars (with a temperature of 10,000°C) can be 'seen' by looking at
ultraviolet radiation and finally hot gas (with a temperature of 10,000,000°C) produces X-rays.
These are just a few examples of the many different sources in the universe
that produce different types of radiation. However, I hope to have given you an idea
of where radiation (and thus visible light) comes from.

Brief history of Willeke: Who am I?
Sort description about me
As a scientist I have learned that we often forget to tell about ourselves.
What do I mean by that? Well, just imagine going to a gathering (aka. conference).
You were asked to present your research to fellow participants. You are so happy
to know that others want to hear more about your research. Full enthusiasm you
start your presentation. After putting your full year of research in a talk of 10
minutes, the first question you get from the public: "Nice presentation, but what
was your name and where do you come from?".
Important Lesson 1: Never
forget to introduce yourself! Especially as people would maybe like to work together
with you on a next project.
SO: Lets introduce myself. My name is Willeke. My absolute favourite colour is blue!
That's why the girl I drew has blue hair. I have, as friends say, orange hair. I'm addicted
to apples and love to bake! Ever since I was a child I was curious about natural phenomena.
In addition, I was intrigued to figure out how THINGS work. Have you ever tried to take apart
a pencil and put it back together? Well, do not try this with a toaster.. I can assure, this is
way more difficult to put back together! I love physics and mathematics. With computers, I have
this hate/love relationship.

What? How? Why?
Three questions that are important every day in the life of a scientist
As an astronomer, I am very lucky to have the universe as my laboratory. But what are astronomers actually doing? It always sounds like we don't keep our feet on the ground but only think about the universe. Many astronomers look at stars, or many stars together, like galaxies, but I am different. I don't look at stars, but at planets. Actually I truly love all planets in our solar system, especially the Earth. But during my normal days, I am actually looking for planets that contain life, just like the Earth. But how do we know if there is life on other planets? Why is the sky blue? How do rainbows form? During my research I will come across these and many more questions by looking at the Earth. Do you like to know some of the answers, or just want to know how the life of a researcher looks like? I will share my experiences and answers to some of the most interesting questions with you.

Drawings